Elia EDS restrictions, as hours you can plan against
Elia describes a flexible connection with EDS parameters: percentages of time and of energy. A project needs those percentages as a timeseries before it can tell whether the site works. We do that conversion, then size what covers the shortfall.
An Elia connection study states the flexibility attached to the connection through four parameters: the share of time under preventive flex, the share of time under curative flex, the share of active energy affected, and the flexible energy in MWh per year. Each grid build-out phase has its own set, so the terms change as reinforcement work lands.
Those four numbers are a summary, not a profile. They say how much of the year is restricted without saying which hours, and the answer a project needs depends entirely on which hours. We reconstruct an hourly power limit per site from the EDS bands, combined with regional load profiles published by Elia, Fluvius and ENTSO-E and with the reinforcement dates in the Elia investment plan.
The result is one power limit per hour, per site, per build-out phase. From there it behaves like any other timeseries: it can be run against a load, compared between candidate sites, or aggregated into an annual energy deficit.
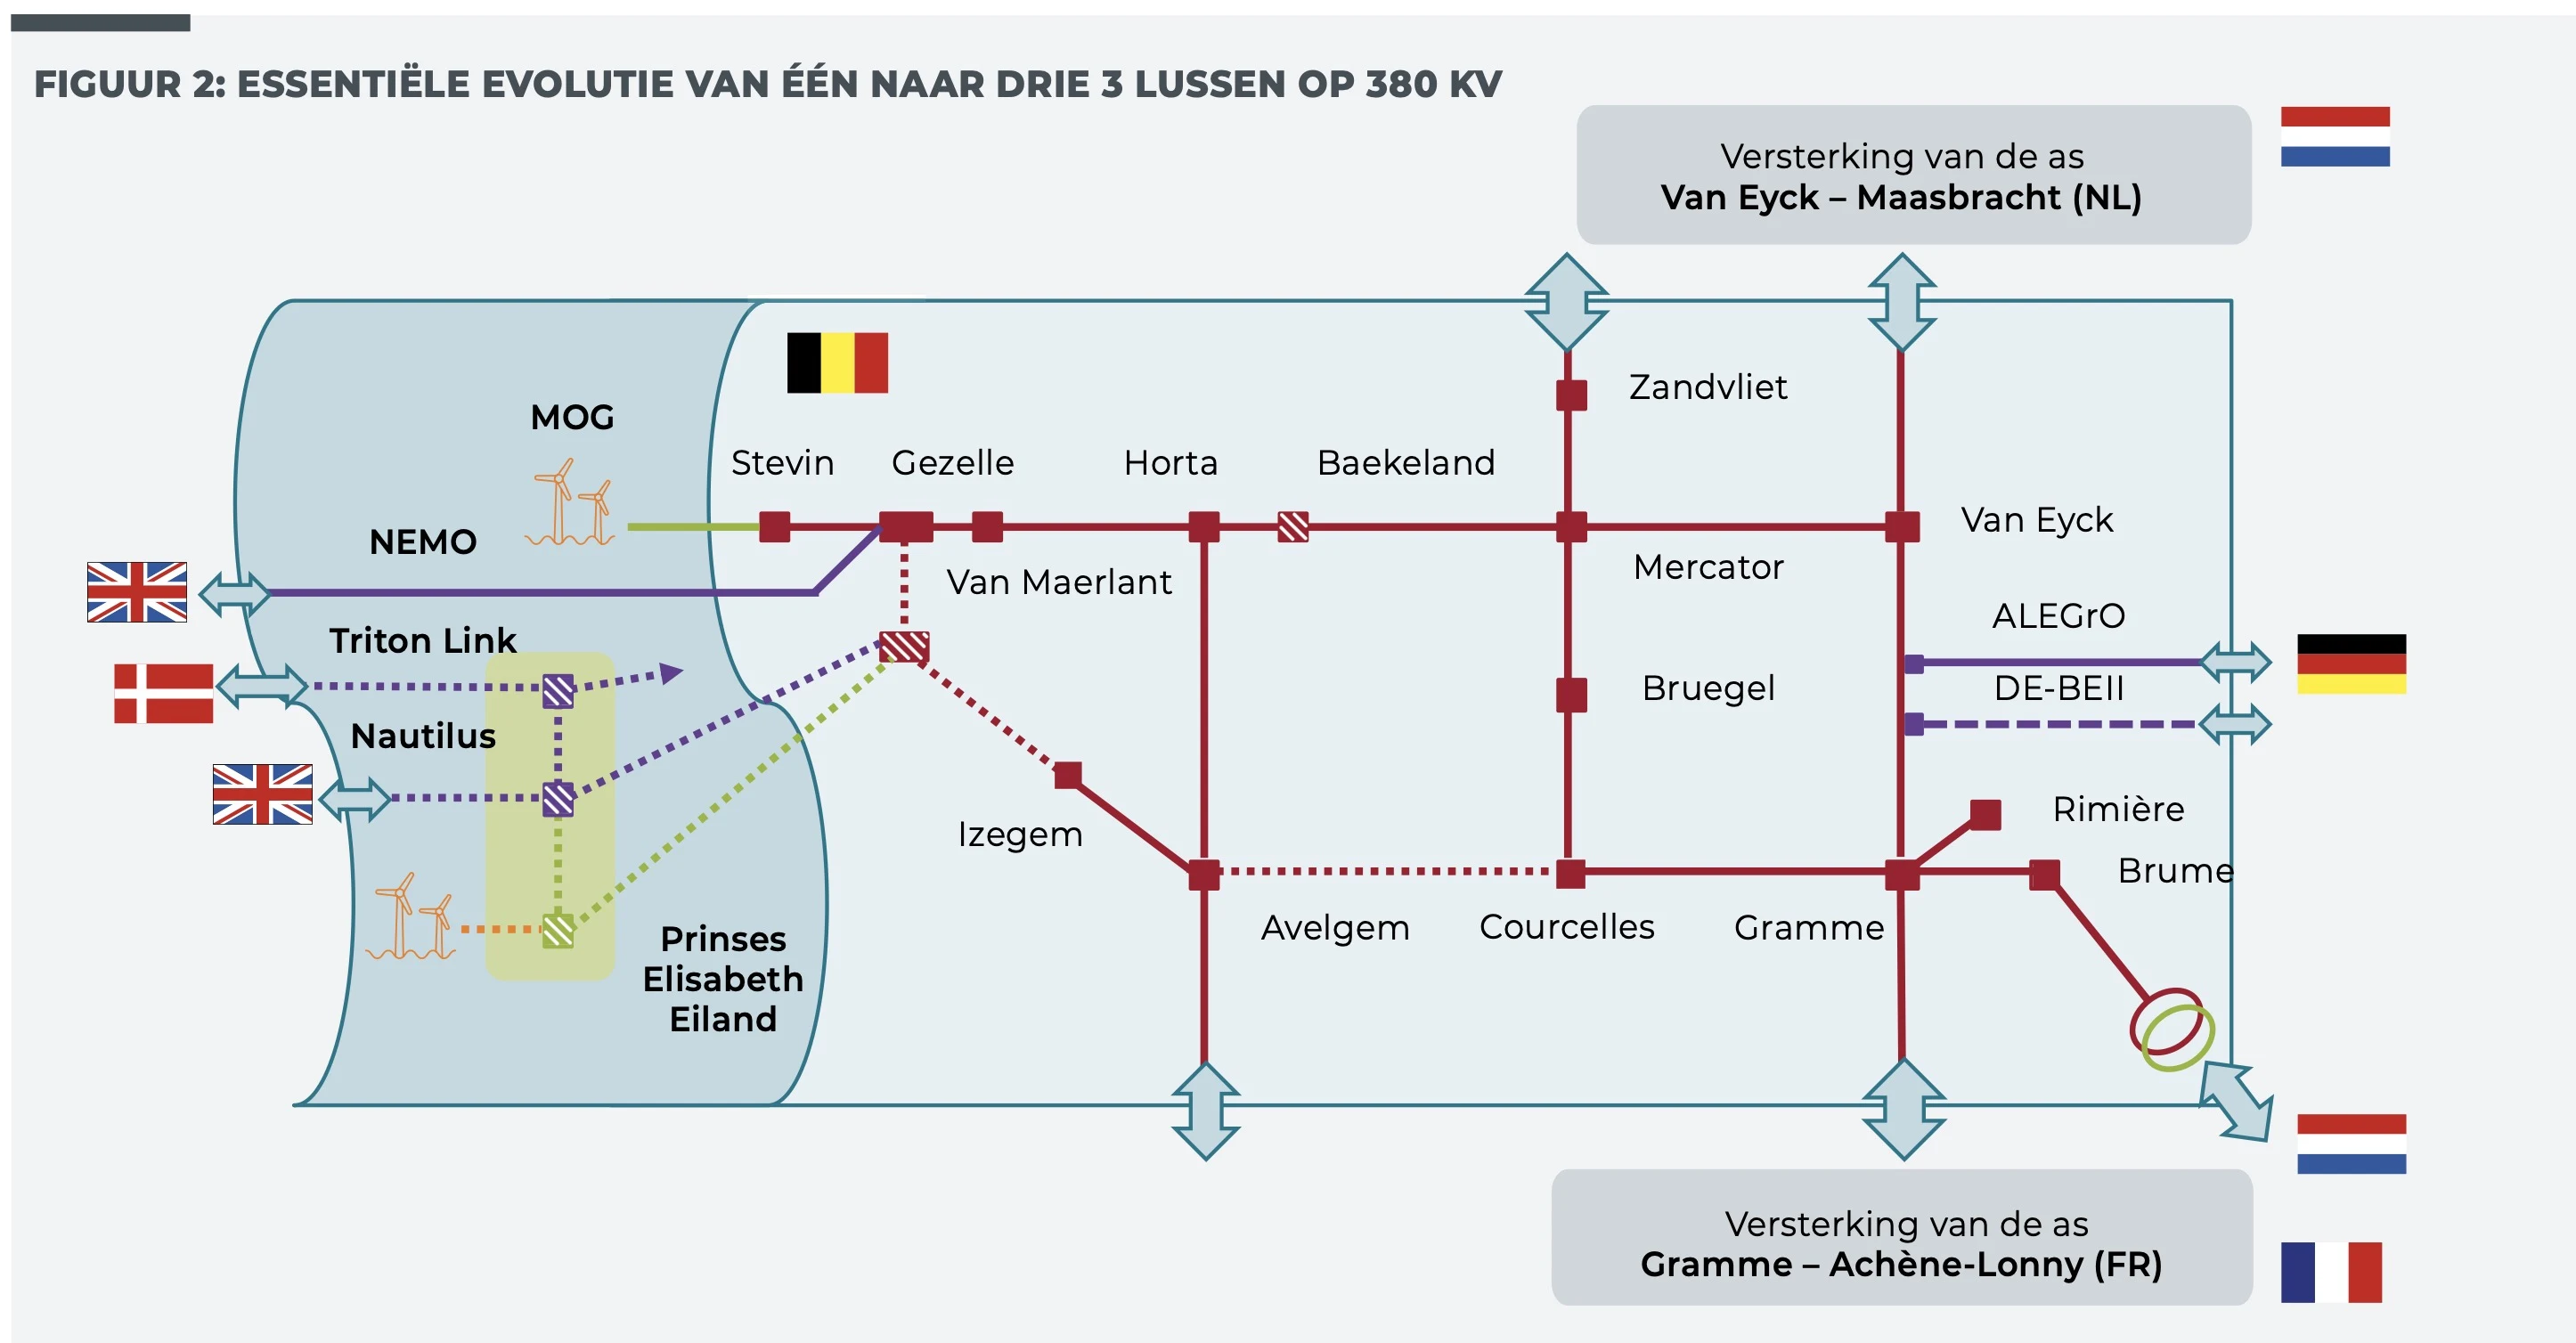
Elia's planned 380 kV build-out, from one loop to three, with the offshore Princess Elisabeth Island and the interconnector axes to the Netherlands, Germany and France. Each reinforcement that lands opens a new build-out phase with its own EDS parameters. Source: Elia.
What the restrictions came to
Across the connection points and build-out phases we modelled, restrictions ran from 2% to 34% of the year. The spread between sites was wider than the spread between years.
Restricted share of the year
Reported per site and per phase, so a site that clears after reinforcement is distinguished from one that stays constrained after the build-out is complete. On a conservative reading of the EDS terms, some sites stay constrained throughout.
Congestion heatmaps
Restricted hours plotted over hour of day against day of year. This is where the annual percentage stops being enough: the same 10% costs very different amounts depending on whether it lands on the site's summer cooling peak or on a spring night.
Net energy deficit
The energy the site cannot draw, as a share of what a firm connection of the same size would have delivered. This is the number the back-up sizing runs on, and it is well below the restricted share of hours whenever the restrictions miss the load peak.
Share of the connection withheld, by hour and month
One representative site: 671 restricted hours a year, 7.7% of the year. Restrictions are contractual blocks, triggered on cold weekdays.
An EDS band either applies or it does not, so the limit moves in blocks: a morning window and a longer evening window, on weekdays, deepest in January and February.
A load model with the cooling in it
A restriction only costs energy in the hours the site would have drawn power. Which means the deficit depends as much on the load shape as on the restriction profile, and a datacenter load shape is not flat.
IT load carries a day and week rhythm. Cooling and auxiliaries do not follow it: they track ambient temperature, so the site's own peak lands on summer afternoons and shifts between weather years. We model the two separately and drive the cooling component from real weather years. A flat load gets the annual energy about right and its overlap with the restricted hours wrong, and it is the overlap that sets the deficit.
Running several weather years also shows how much of the deficit is weather and how much is the grid, which matters when the back-up has to be sized for a bad year rather than an average one.
Covering the deficit: batteries, gas or diesel
Once the deficit is hourly, the back-up question becomes a sizing problem rather than a rule of thumb. The permit turns out to matter as much as the capital cost.
Diesel gensets
Lower capital cost per MW, and the option most sites already have on hand for outages. The binding constraint is the permit: running hours are capped at 500 full load hours per year, so once the restricted hours climb past that, diesel cannot carry the deficit on its own regardless of how the cost compares.
Gas gensets
Higher capital cost, and no comparable cap on running hours. That is what makes gas the option for the sites where the restricted hours run into the thousands, and what puts the two options on a different footing once the deficit is known.
Battery storage
A battery absorbs the short and frequent restrictions and shaves the peak hours, which is exactly the part that pushes a genset over its permitted hours. Adding storage can move a site from needing gas back to a diesel installation that stays inside its cap, and that swap was material on some of the sites we studied.
One restricted winter week
60 MW IT at PUE 1.30, 80 MW connection, 20 MW / 80 MWh battery, 25 MW genset. The battery discharged in 35 hours this week and the genset ran 32.
The gap peaks at 22 MW. The battery covers the morning windows outright and concedes the evenings, shaving them to the genset's minimum load; state of charge never falls below 28%.
The permit cap is what decides gas against diesel
Run the same site with no storage and the genset covers the whole deficit, about 11.7 GWh spread over 671 hours. Those 671 running hours are what the permit counts, and they sit a third above the 500 hour cap, so the site has no diesel option and has to carry the higher capital cost of gas.
A battery does not simply trim that bill, it changes which technology is allowed. The permit counts hours, not energy, so shaving a little off every window saves fuel and no hours at all. What saves hours is eliminating whole windows. On this site the crossover sits between 15 MW by 60 MWh, which still leaves 546 genset hours, and 20 MW by 80 MWh, which brings it to 425 and inside the cap.
Two constraints decide where that crossover lands, and neither is visible in an annual average. The evening window needs about 82 MWh to cover outright, so an 80 MWh pack holding a 10% reserve covers the morning window and concedes the evening one, shaving it down to the genset's minimum loading. And recharging runs on the headroom under the connection, 9 to 14 MW on a winter day, so the battery needs the quiet hours between windows to come back. Both fall out of the hourly profile.
What it takes to keep diesel legal
Genset running hours per year against battery size, on a profile of 671 restricted hours. First size inside the 500 h cap: 20 MW / 80 MWh.
With no storage the genset runs in every restricted hour. 15 MW / 60 MWh still leaves 546 hours, over the cap; 20 MW / 80 MWh brings it to 425, inside it.
We size the three against each other on the same hourly deficit and report the combination per site. The crossover moves with the restriction profile and with the load shape, which is why the timeseries has to come first.
Reference and the next step
The Belgian work was part of a set of studies for a datacenter developer active worldwide, covering planned sites in the Netherlands and Belgium between 30 and 150 MW. Site names, locations and results stay with the client.
An EDS reconstruction is a worst-case reading of the terms Elia has written down, which is the right basis for a go or no-go and a conservative one for sizing. The step beyond it is a power-flow simulation of the Belgian high-voltage grid, which replaces the contractual bands with the physical limits that produce them. That is the same method BirdFlow applies to the Dutch grid.
With the connection documents, the site location and the capacity you are requesting, we come back with the hourly restriction profile, the energy deficit and the back-up capacity that covers it.