
Forward power price curves to 2050
BirdCurve turns market fundamentals into forward price curves at 15-minute resolution, for every market a battery earns in: day-ahead, intraday, imbalance, aFRR and FCR. One internally consistent scenario set behind every revenue assumption in your business case.
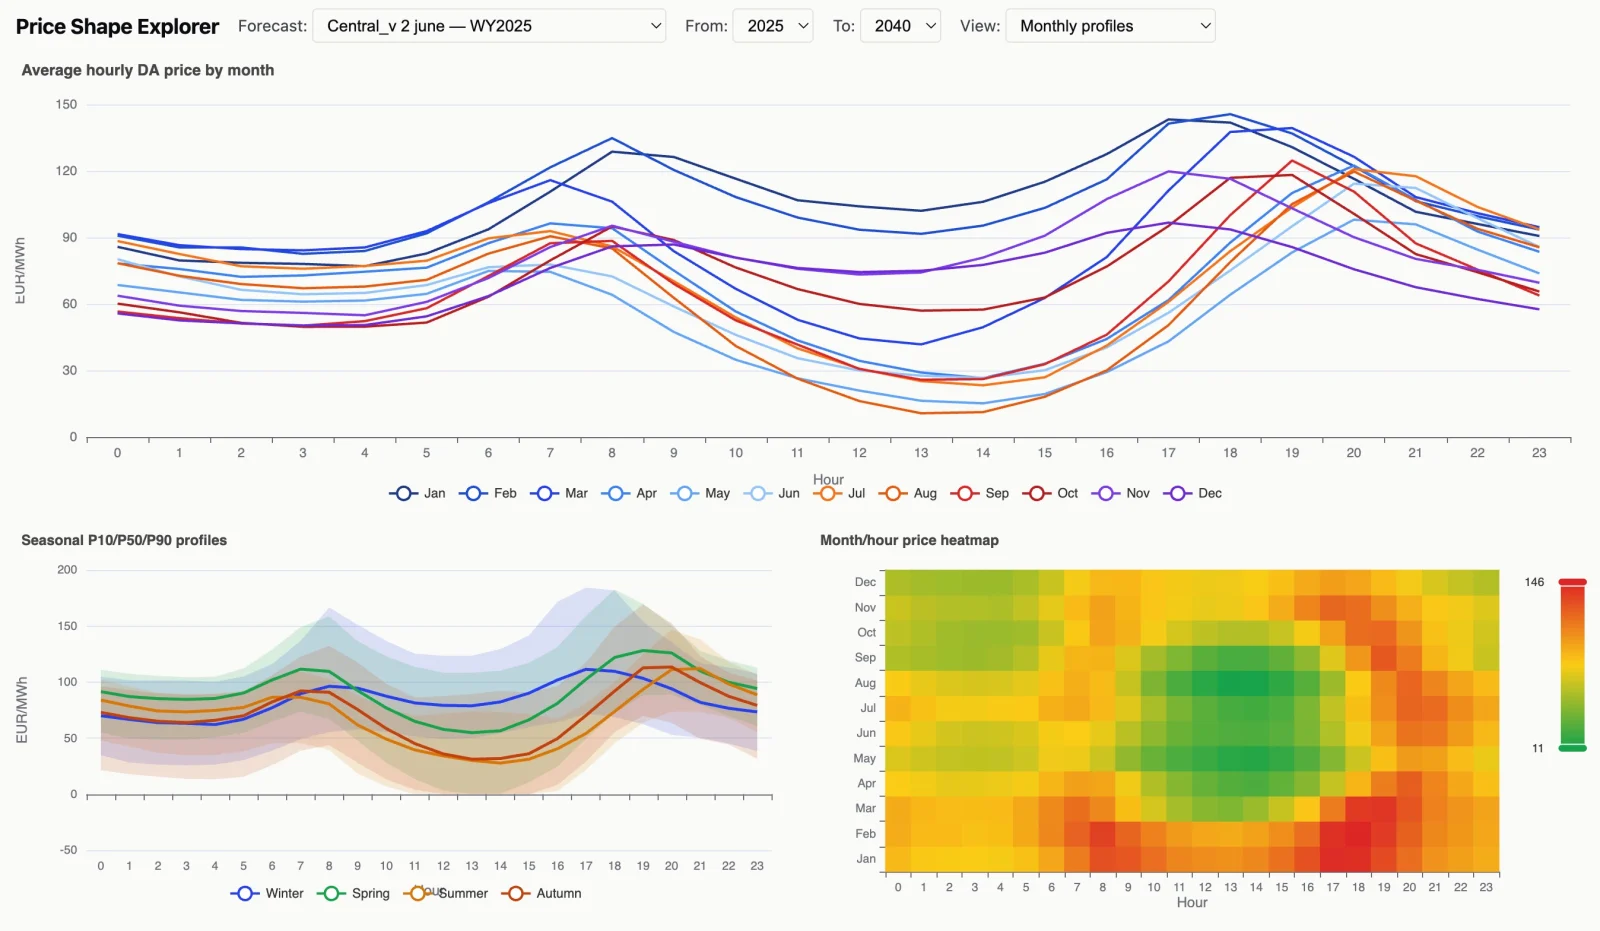
The Price Shape Explorer: seasonal P10/P50/P90 bands, monthly average profiles and the annual price spread out to 2050, straight from the forward curve
How BirdCurve builds a forward curve
A forward curve is only as good as the fundamentals behind it. BirdCurve learns from real prices where the data supports it, falls back on physical modelling where it does not, projects the drivers you choose, then shapes the result down to 15 minutes.
Trained on real prices, grounded in physical modelling
BirdCurve trains gradient-boosted models on years of historical day-ahead and balancing prices, learning how gas, CO2, renewables, demand and cross-border flows actually set the price. That is the right tool for a market that looks like the one we have measured.
The future energy system does not. So where the data runs out of evidence, at deep negative prices, in hours of heavy curtailment, at scarcity peaks and under battery saturation, BirdCurve falls back on explicit physical modelling of the merit order and the system balance. The curve stays realistic in a 2040 market no historical dataset has ever seen, instead of extrapolating today's price patterns decades forward. Every driver stays on the table, so you can defend the forecast.
- Learned from data where the evidence is strong
- Physically modelled where it is thin, so future prices stay realistic
- Transparent feature importance, never a black box
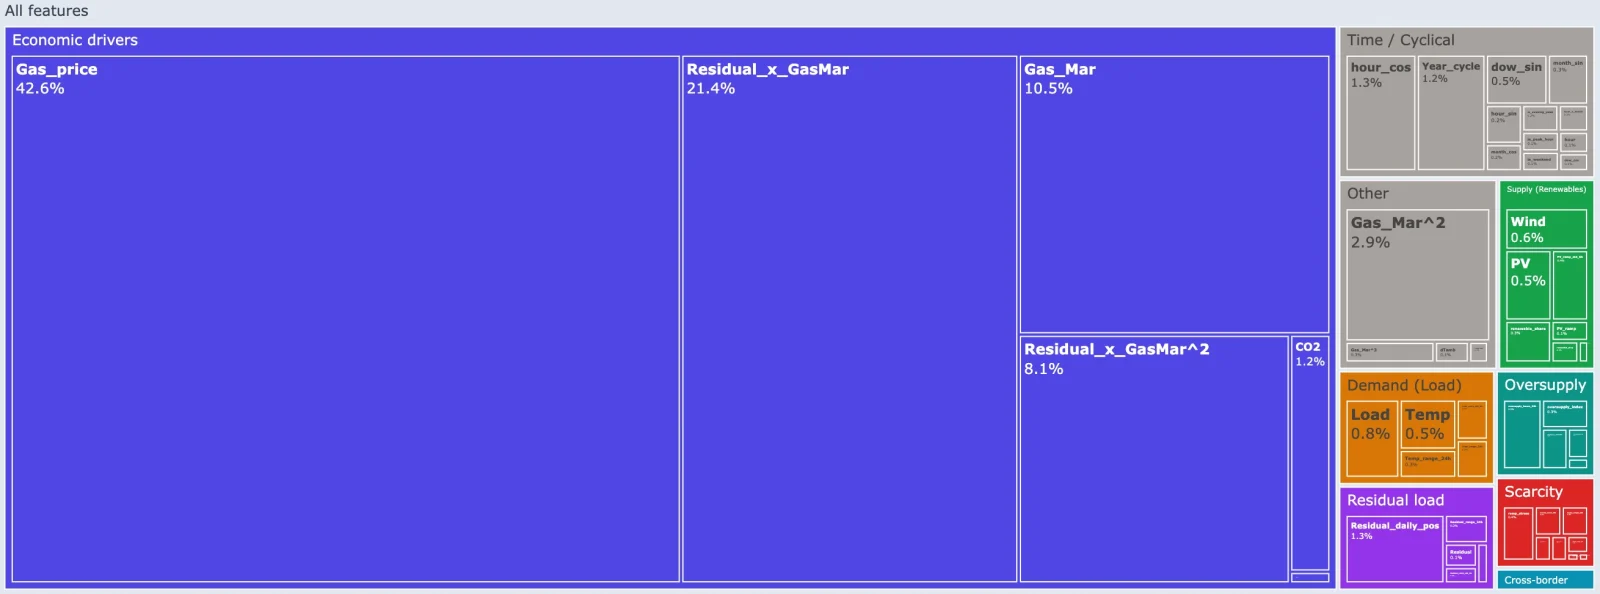
Feature importance, grouped by driver: gas price and gas-residual interactions lead, with renewables, demand, residual load, scarcity and cross-border all fully visible
Statistics and physics side by side: the model learns the price from years of real market data, while battery dispatch and curtailment are modelled from first principles. A fleet of batteries the size the 2040s will hold appears nowhere in the price history, so its effect on the price has to be modelled rather than learned.
One consistent scenario set, every market
You set the drivers: renewable build-out, demand growth, gas and CO2 paths, all anchored to published references like TYNDP, TenneT, NEP and ENTSO-E. Historic actuals come straight from the harvested data, and every scenario is built on the physical capacity that has to be installed, not on a price trend. BirdCurve keeps every market internally consistent, so day-ahead, intraday and balancing all sit behind the same assumptions instead of a patchwork of conflicting sources.
- Anchored to TYNDP, TenneT, NEP and ENTSO-E
- Renewables, demand, gas and CO2 you control
- Internally consistent across every market
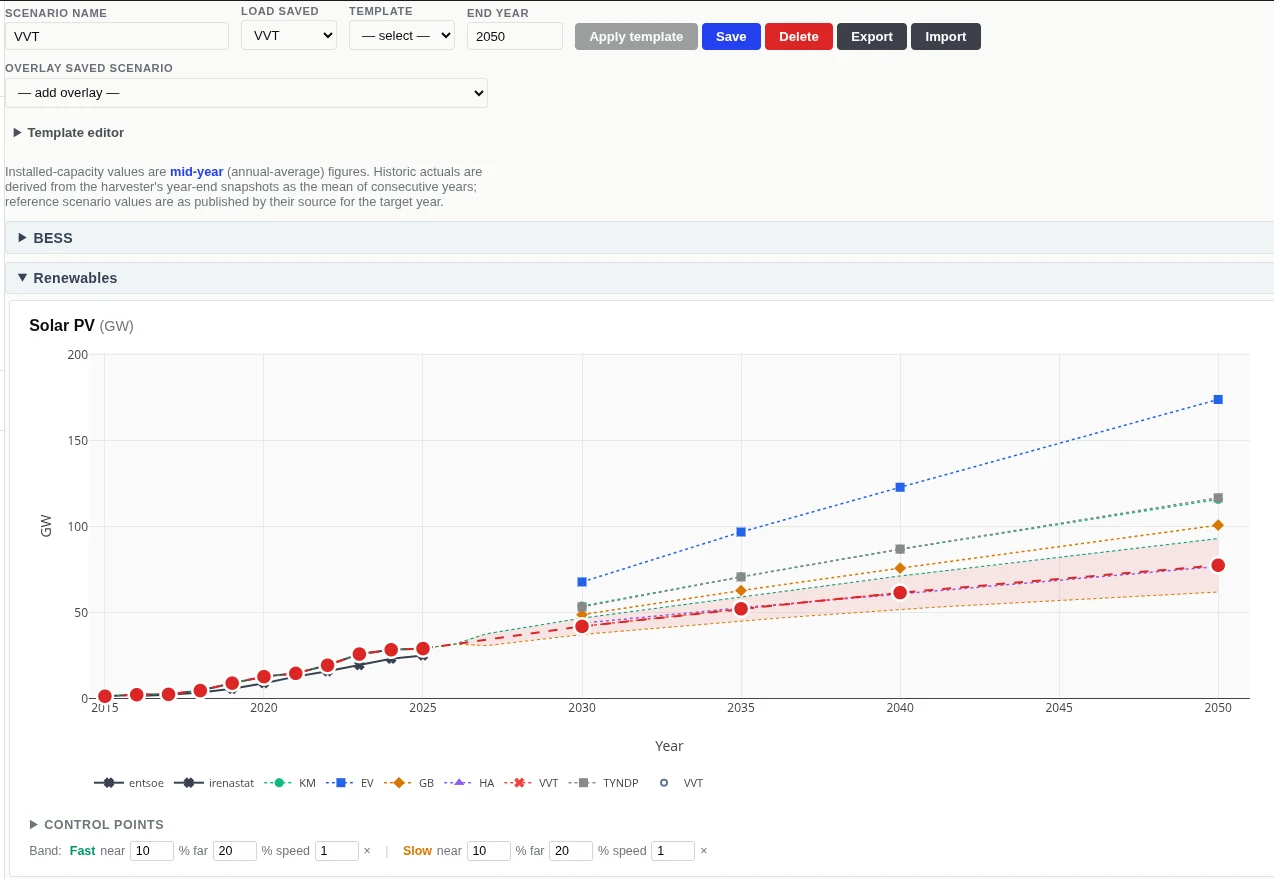
Scenario Explorer: solar PV build-out to 2050 against published references, with your own fast/slow band around it
Forward curves, shaped down to 15 minutes
BirdCurve projects the price out to 2050 and shapes it to 15-minute resolution, capturing the daily and seasonal pattern a battery actually trades against. Each market comes out as a 15-minute price shape that BESSview reads directly.
- Horizon to 2050 at 15-minute resolution
- Daily and seasonal price shape per market
- Read directly by BESSview
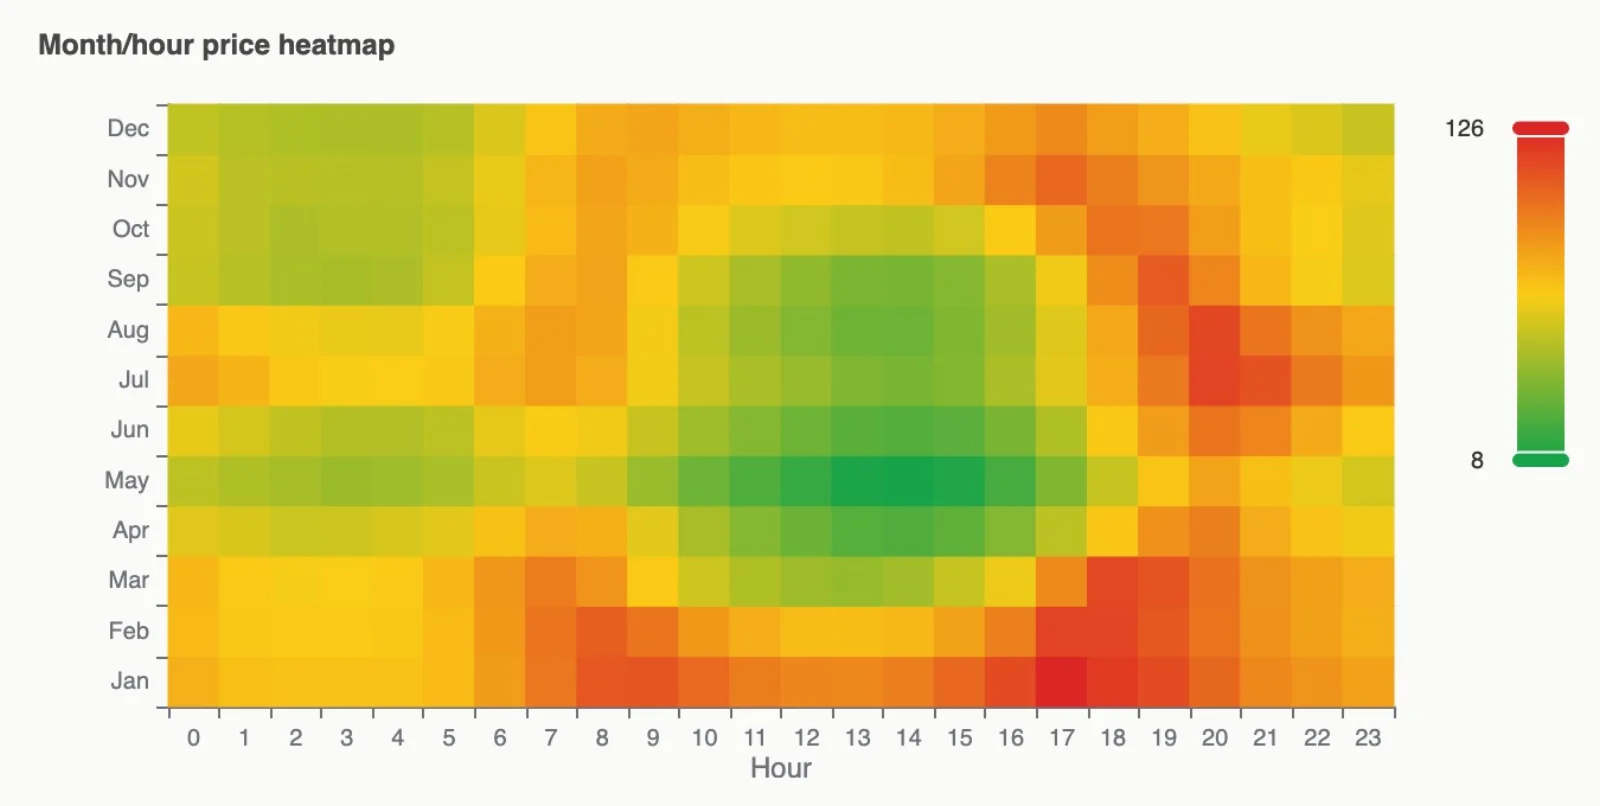
Month-by-hour price shape: where a battery captures value across the day and the year
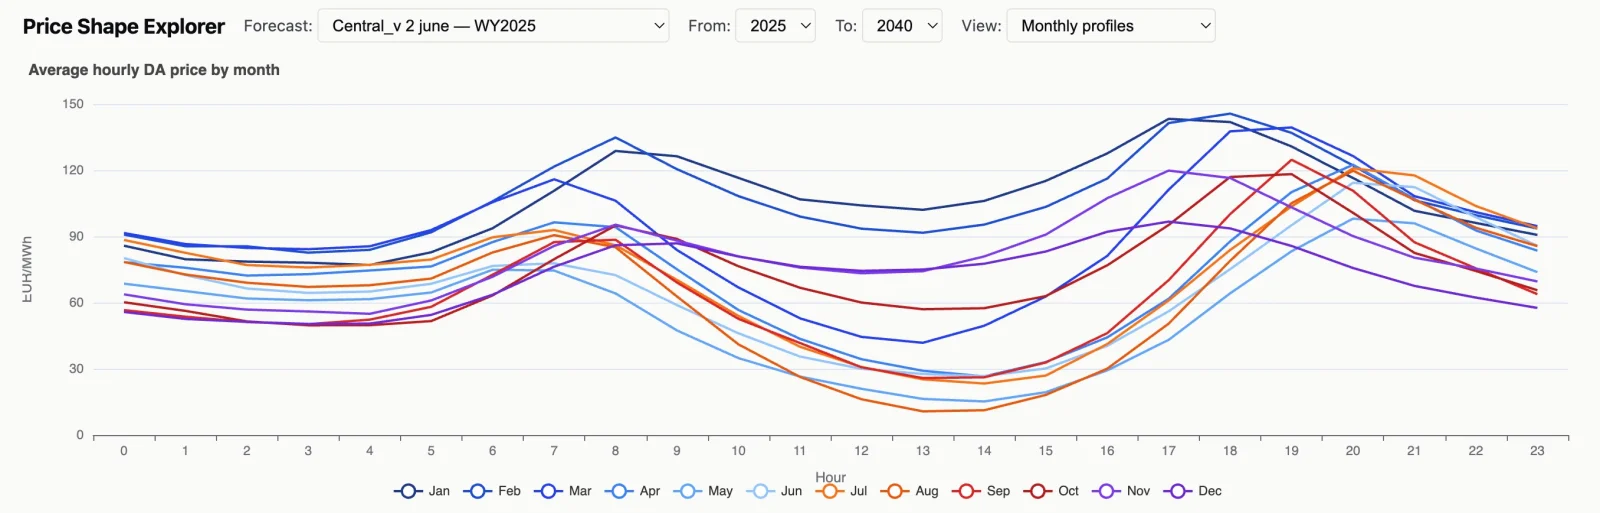
Average hourly day-ahead price by month, 2025 to 2040: the shape behind every capture-rate assumption
Validated on prices it never saw
BirdCurve is scored on a held-out period and reports the error in EUR/MWh.
Backtested, with the error in euros
Every trained model is scored on a held-out validation set, in euros per MWh. The active model was trained on data up to 30 June 2026, on 248.164 training and 49.728 validation hours, with a validation MAE of 15.72 EUR/MWh against 14.69 EUR/MWh on the training set. A gap of 1.03 EUR/MWh (7%) means it generalizes to prices it never saw rather than memorizing the ones it did.
BirdCurve breaks the error down by price band, so you know where the curve is strong and where it is uncertain: around €10 per MWh in normal hours, wider in the scarcity peaks and deep negative hours where the physical modelling takes over from the statistics.
And because each model is versioned with its training window and metrics, you can compare vintages side by side and watch the curve improve over time.
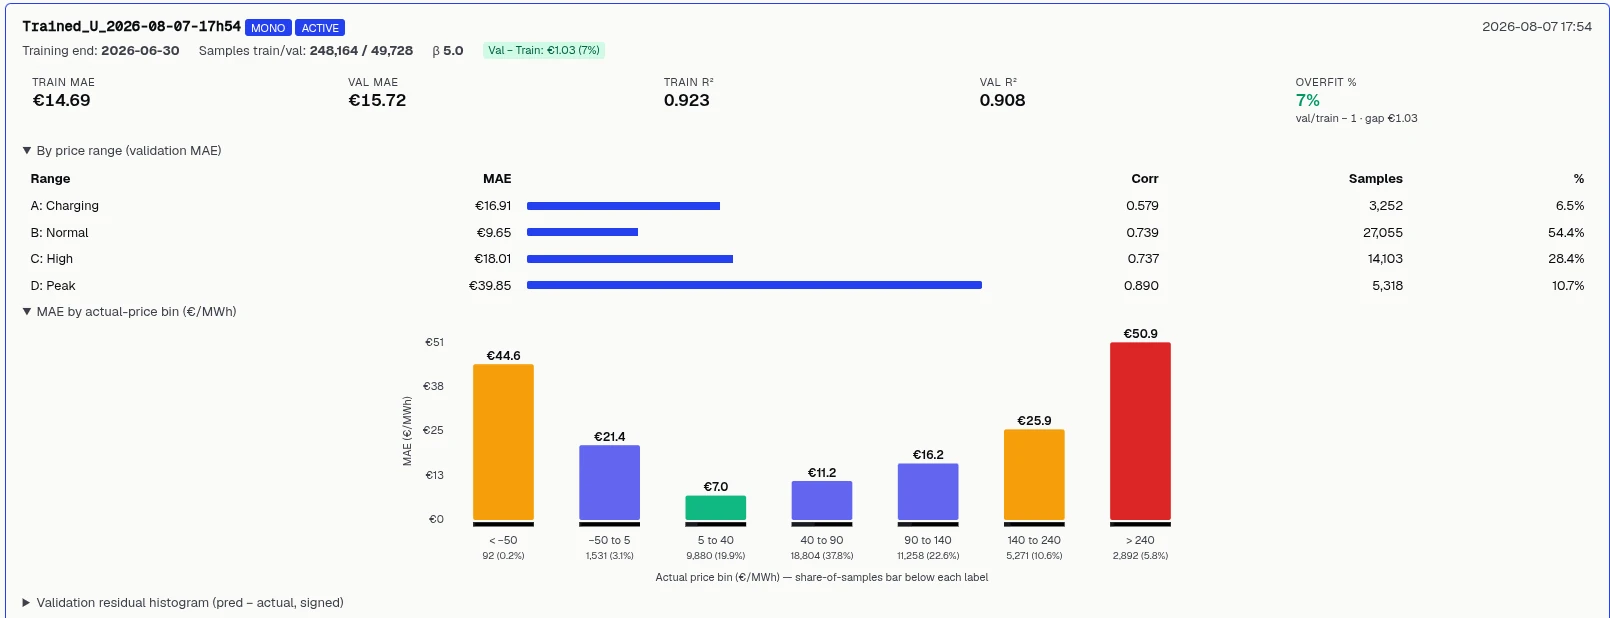
The model card: train and validation MAE in euros, R², and error by actual-price bin, reported per model vintage
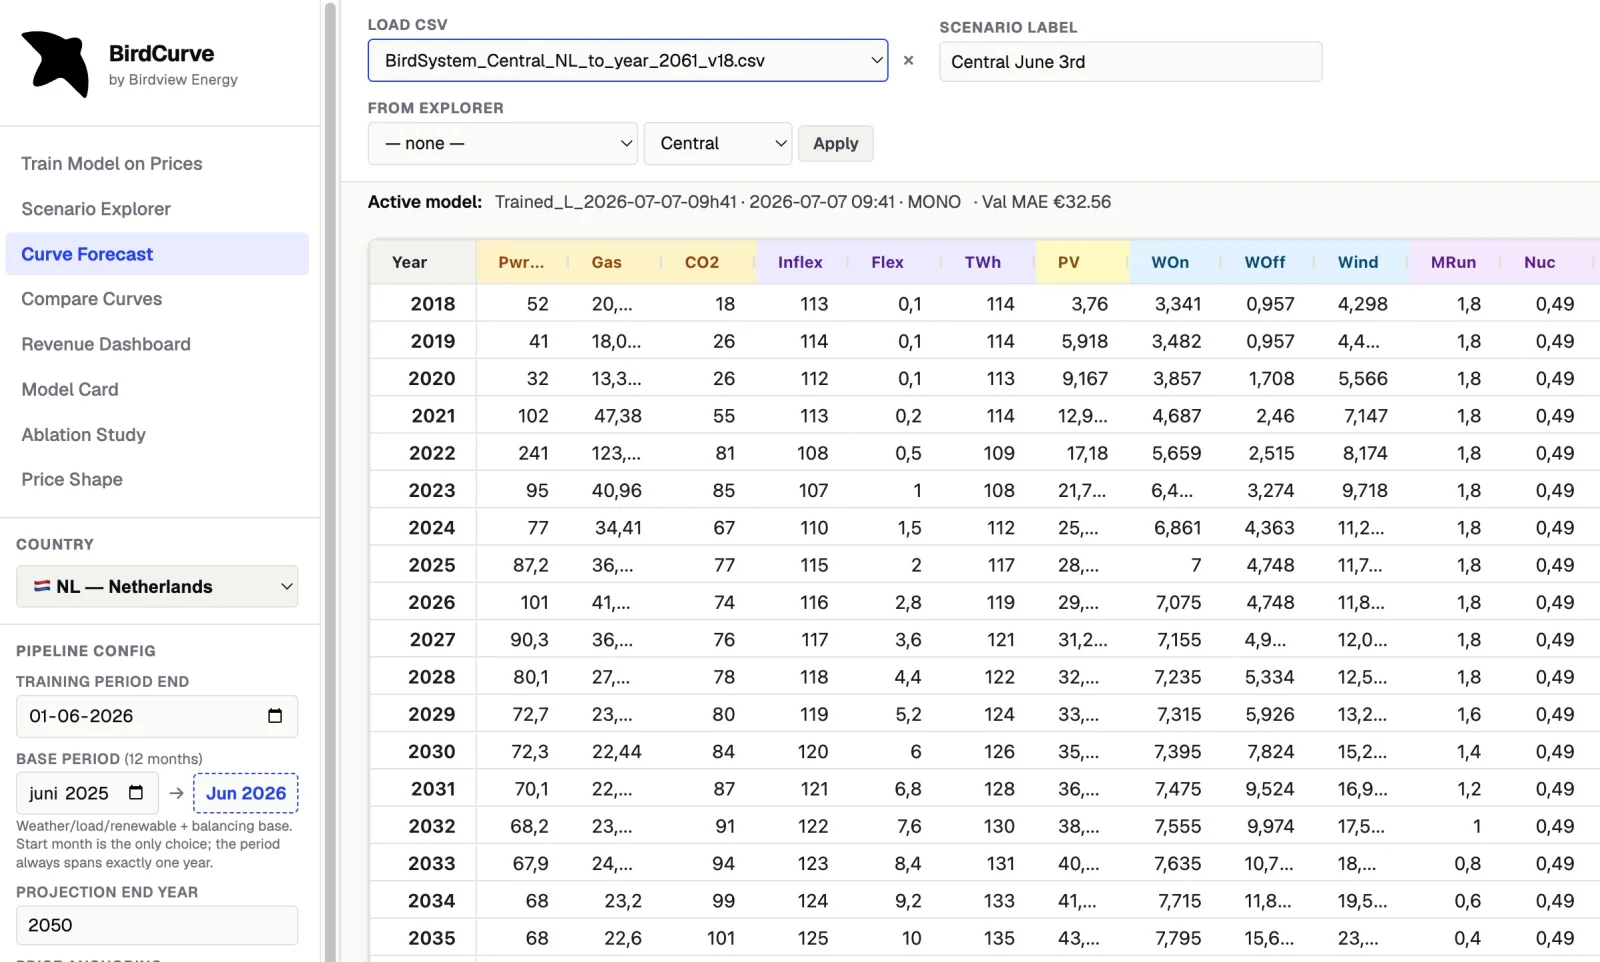
The Curve Forecast: power, gas, CO2, the full renewable build-out and BESS capacity projected out to 2050, per scenario
Built for decisions that ride on the price
If your business case, PPA or credit rests on where power prices go, BirdCurve gives you a forward curve you can defend.
BESS developers & investors
Underpin your capture-rate and revenue-stacking assumptions with a forward curve that stays consistent across every market, so your BESSview business case rests on one scenario set.
Traders & PPA providers
Price multi-year PPAs, tolling deals and structured products against a transparent 15-minute price shape, with the scenario band that frames your upside and your downside.
Lenders & financiers
A price deck you can interrogate: fundamentals-driven, backtested in euros and anchored to published scenarios.
Get a BirdCurve forward curve for your project
Ask us for a BirdCurve forward curve for your markets and horizon, or let us walk you through the model on a live demo.