
Know what the grid will really allow — hour by hour
BirdFlow simulates power flows on the full Dutch transmission grid and turns them into the expected hourly grid restrictions per location for 2027–2036. So BESS, datacenter and industrial projects know what their connection will actually deliver — before they commit.
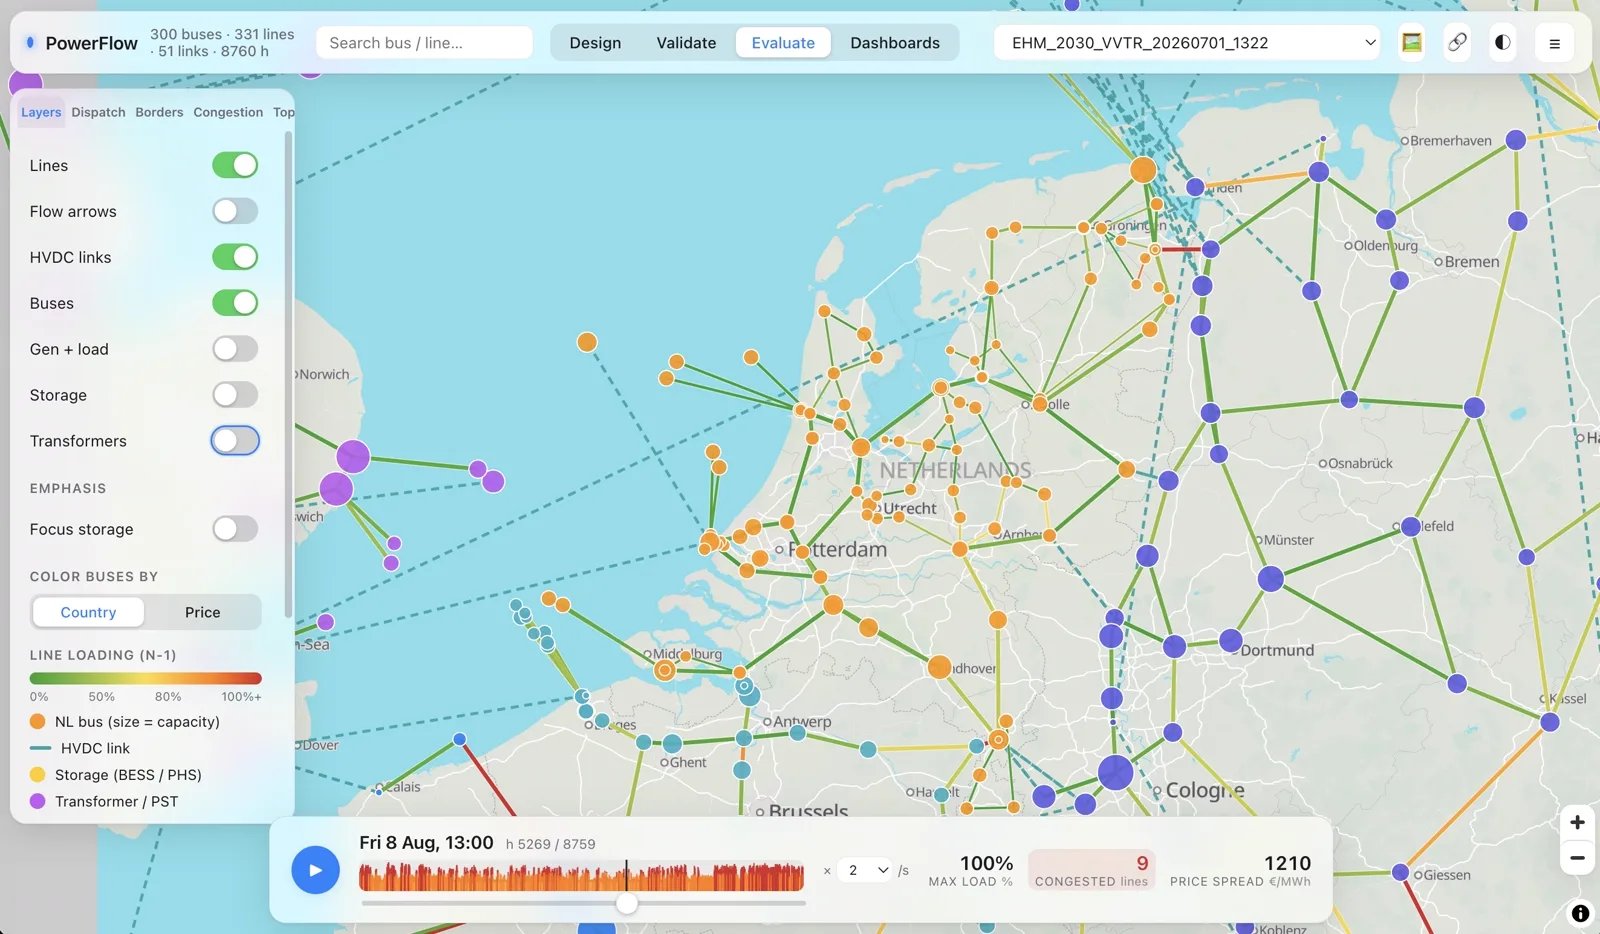
The PowerFlow web interface — 300 buses, 331 lines, 51 HVDC links, every hour of the year on an interactive map
How BirdFlow models congestion
Congestion is not a guess — it is the physical outcome of topology, demand and generation. BirdFlow models all three, then simulates the power flows that follow.
The grid as it is — and as it will be
BirdFlow starts from the complete Dutch transmission network, built on PyPSA-NL: every 380, 220, 150 and 110 kV line, substation, transformer and HVDC interconnector. On top of that we layer the announced grid reinforcements — new circuits, transformer capacity, offshore wind landings — each in its expected commissioning year, so every future year is simulated on the grid that will actually exist by then.
- Full 380/220/150/110 kV topology, substation by substation
- TenneT investment plan: upgrades in their commissioning year
- Offshore wind landing routes and interconnectors included
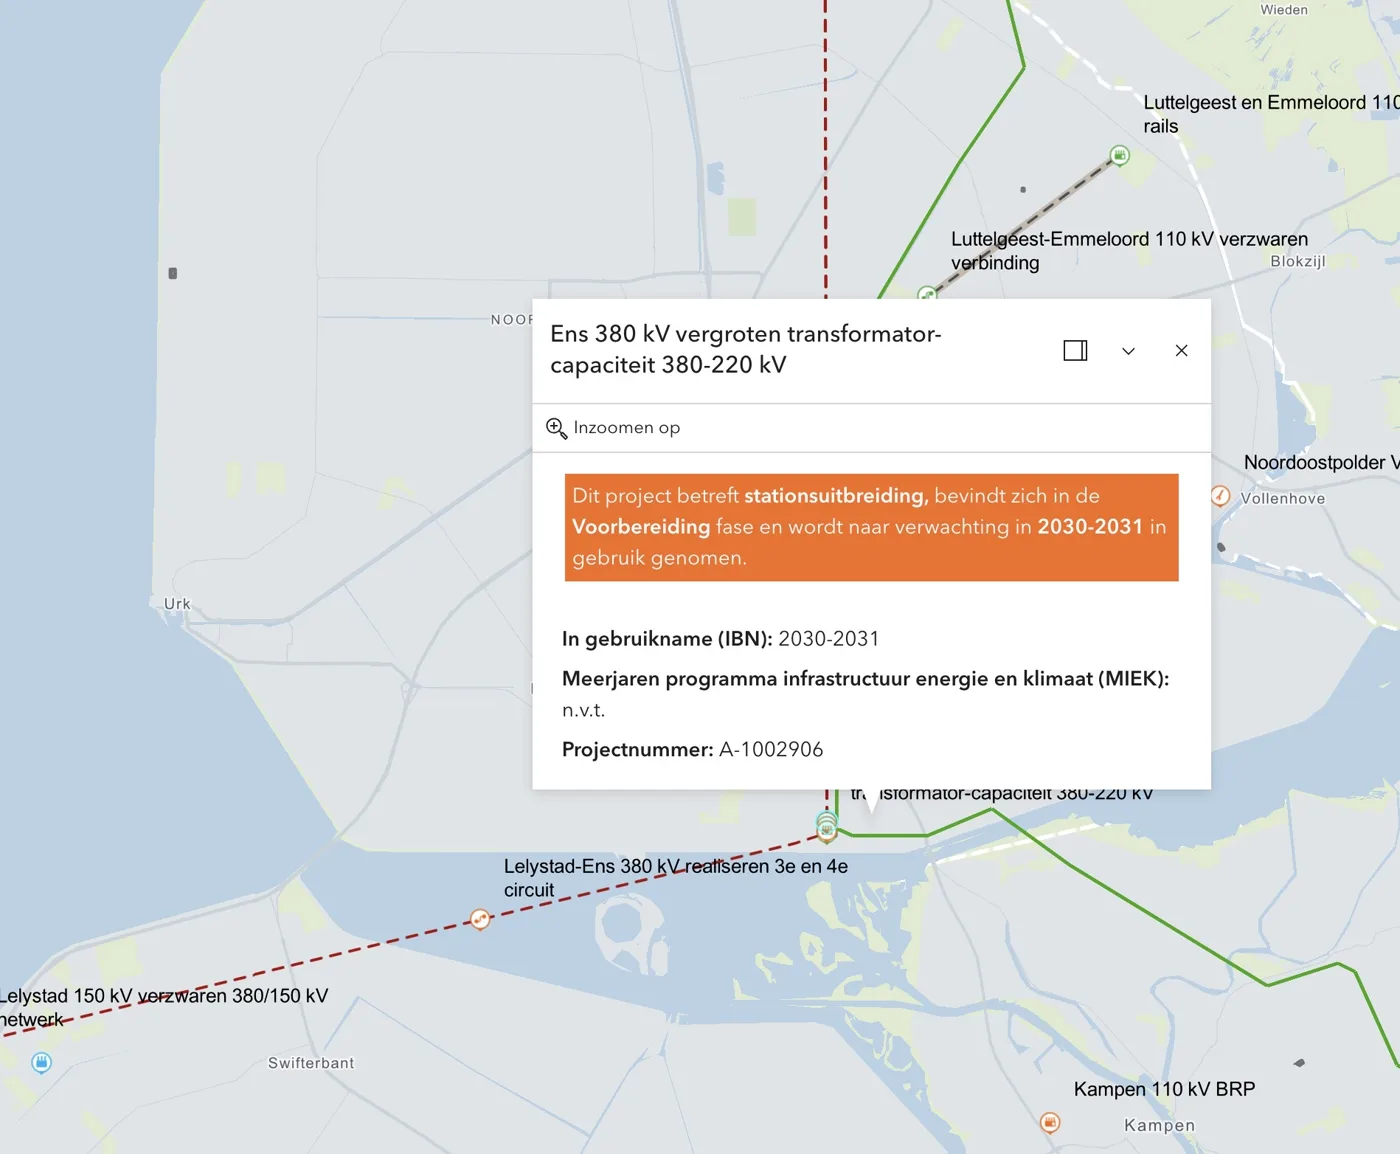
Planned reinforcements — like this 380/220 kV transformer expansion at Ens (in service 2030–31) — enter the model in the year they go live
Every plant, every load, at the right substation
Congestion is local, so national totals are useless. BirdFlow regionalizes demand — electrification, datacenters, industry, EV and heat — down to the individual substation, and places every fossil and renewable plant where it physically connects. Wind and solar production follow real weather years, hour by hour.
- Load growth regionalized to substations
- All fossil plants plus wind, solar and storage
- Weather-based hourly wind and solar profiles
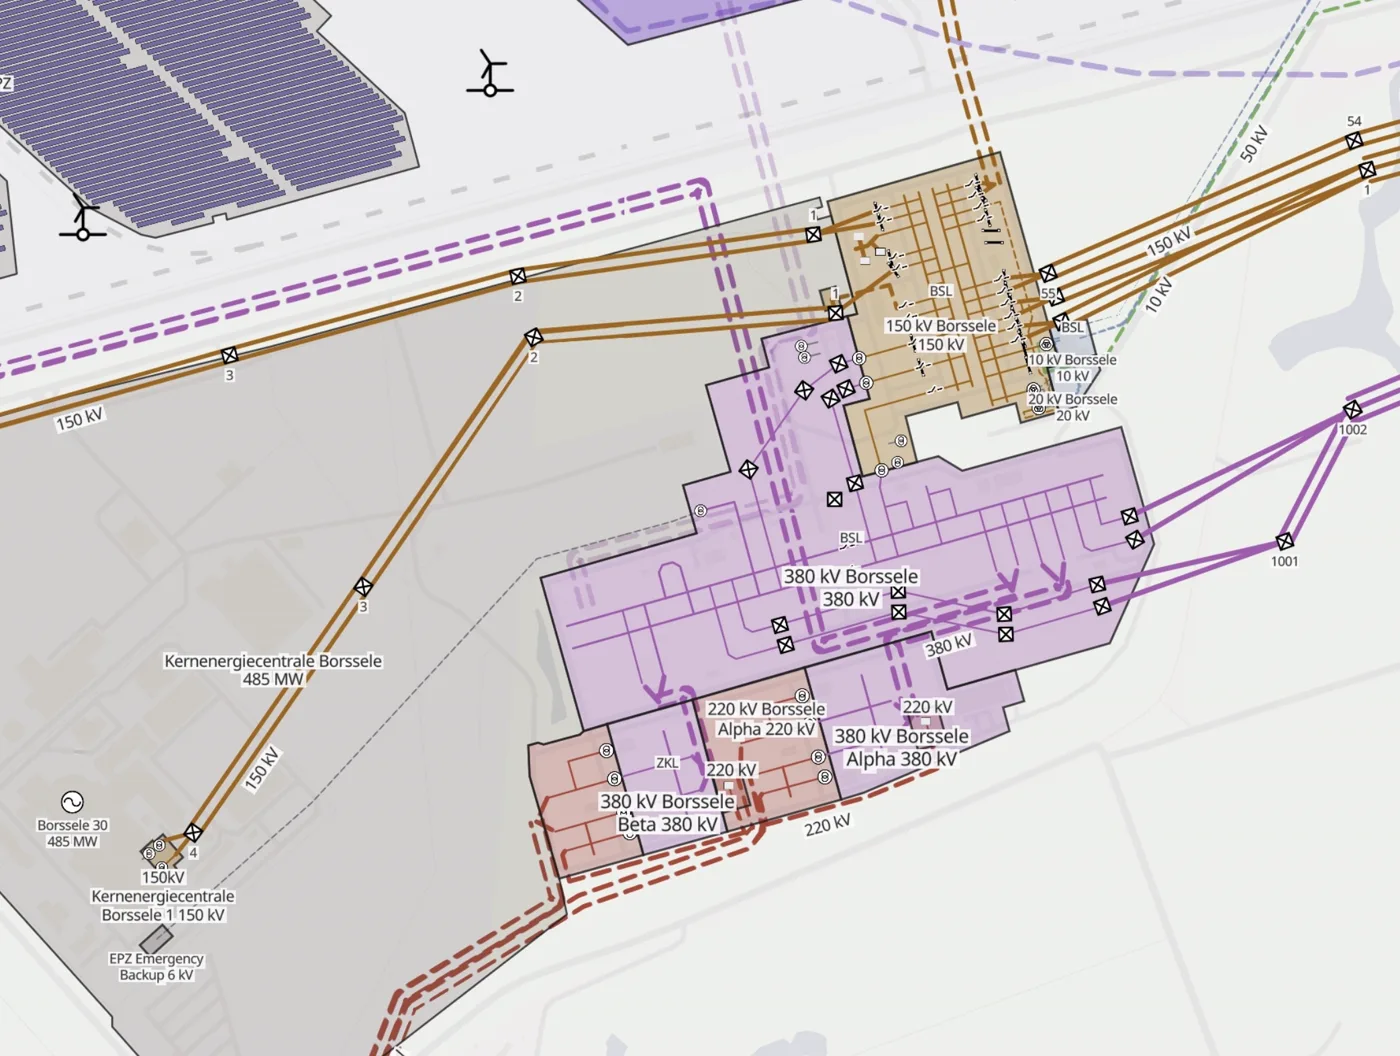
Substation-level detail — here Borssele: 380/220/150 kV yards, the 485 MW nuclear unit and nearby solar, exactly as connected
From power flows to your real restrictions
With topology, demand and generation in place, BirdFlow simulates the resulting power flows for all 8,760 hours of every year from 2027 to 2036. Wherever lines or transformers hit their limits, the model derives the congestion that follows — translated into the expected hourly offtake and feed-in restrictions (TDTR, VVTR) for your specific connection point and requested capacity.
- Hourly line loading incl. N-1 security
- Expected restrictions per location and year, 2027–2036
- Feeds straight into a BESSview business case
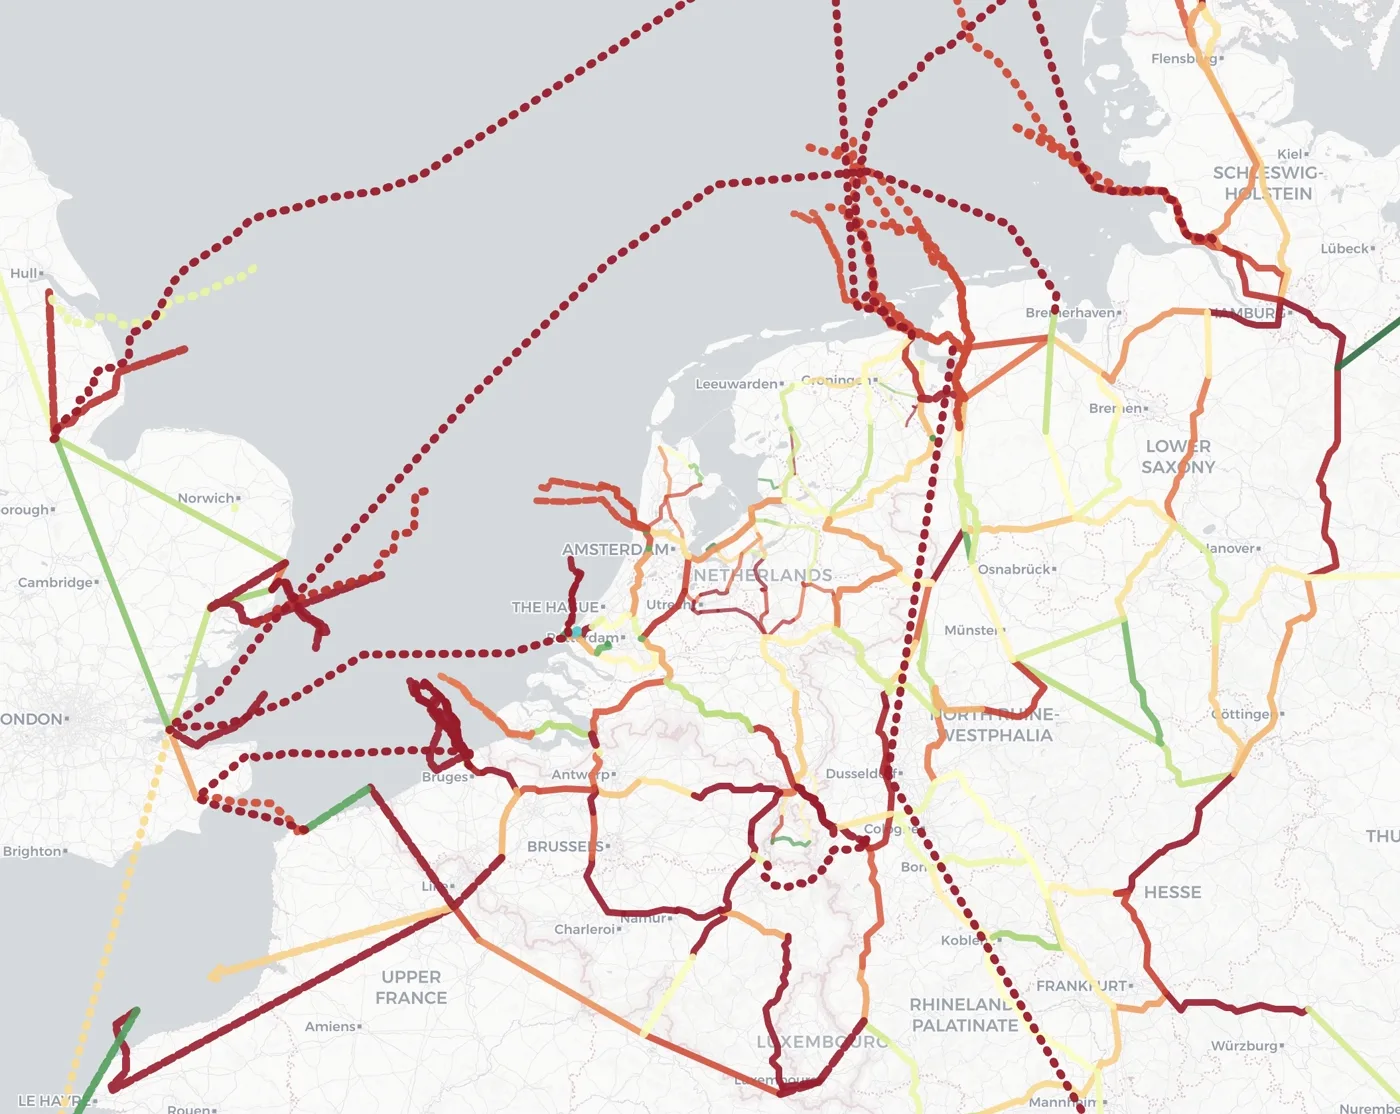
Simulated line loading — green is headroom, red is congestion
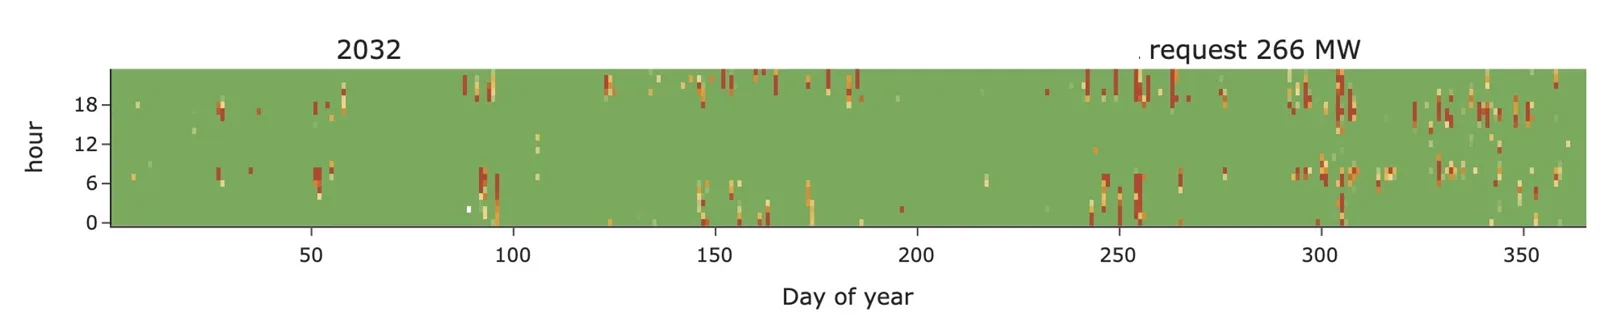
The deliverable: an hour-by-hour restriction profile — here a 266 MW request in 2032, green where the grid delivers, red where it restricts
Validated against reality, not against itself
A congestion model you can't verify is just an opinion. BirdFlow is backtested against what actually happened.
Backtested on ENTSO-E market data
We run the model against past years and compare its day-ahead prices with the published ENTSO-E outcomes — month by month and across the full price duration curve. If the model can reproduce the market that already happened, you can trust what it says about 2030.
And because the model follows the real build-out — substations under construction, offshore wind landings, new transformers — its future years stay anchored to the grid that is actually being built.
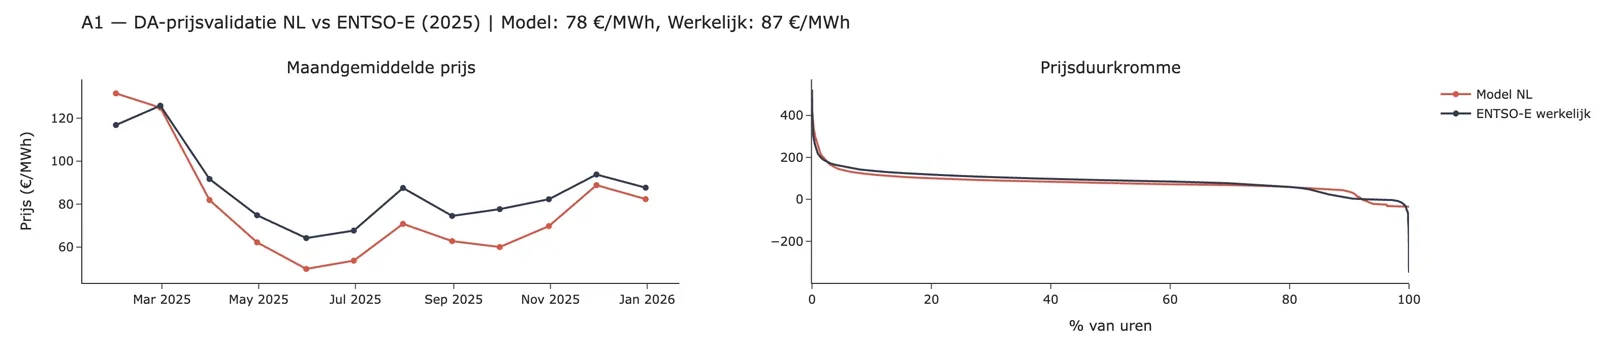
Day-ahead price validation NL: model vs ENTSO-E actuals
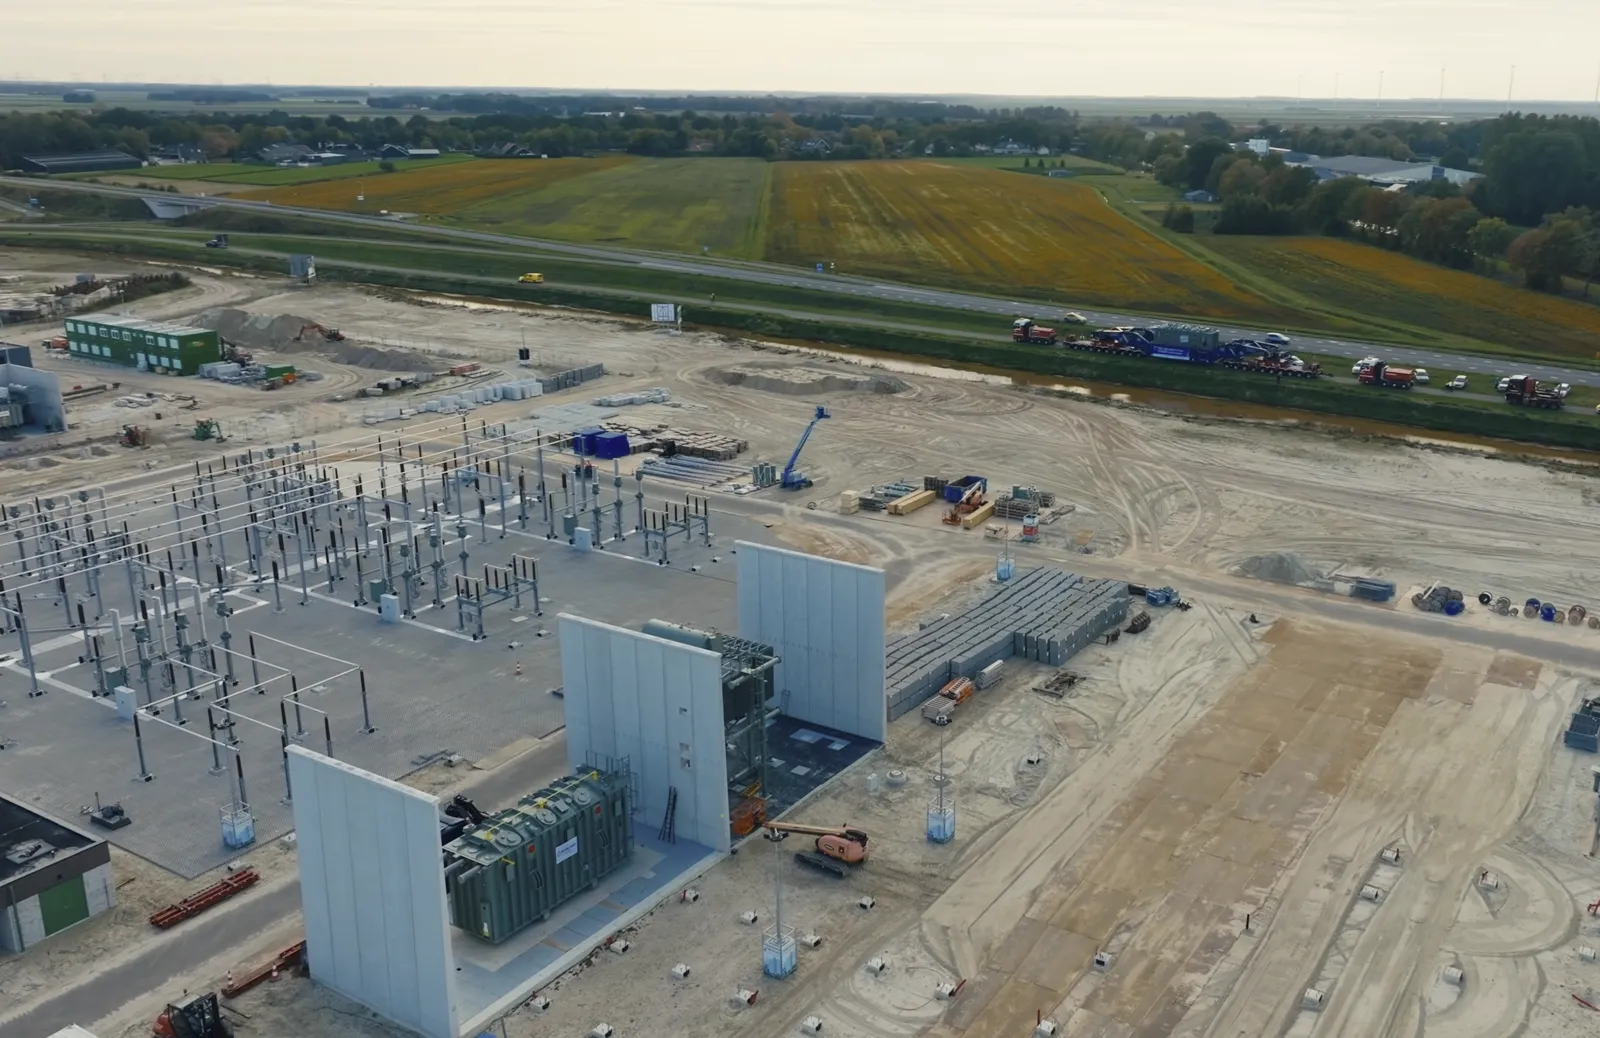
The build-out is real: new 380 kV capacity under construction — and already in the model
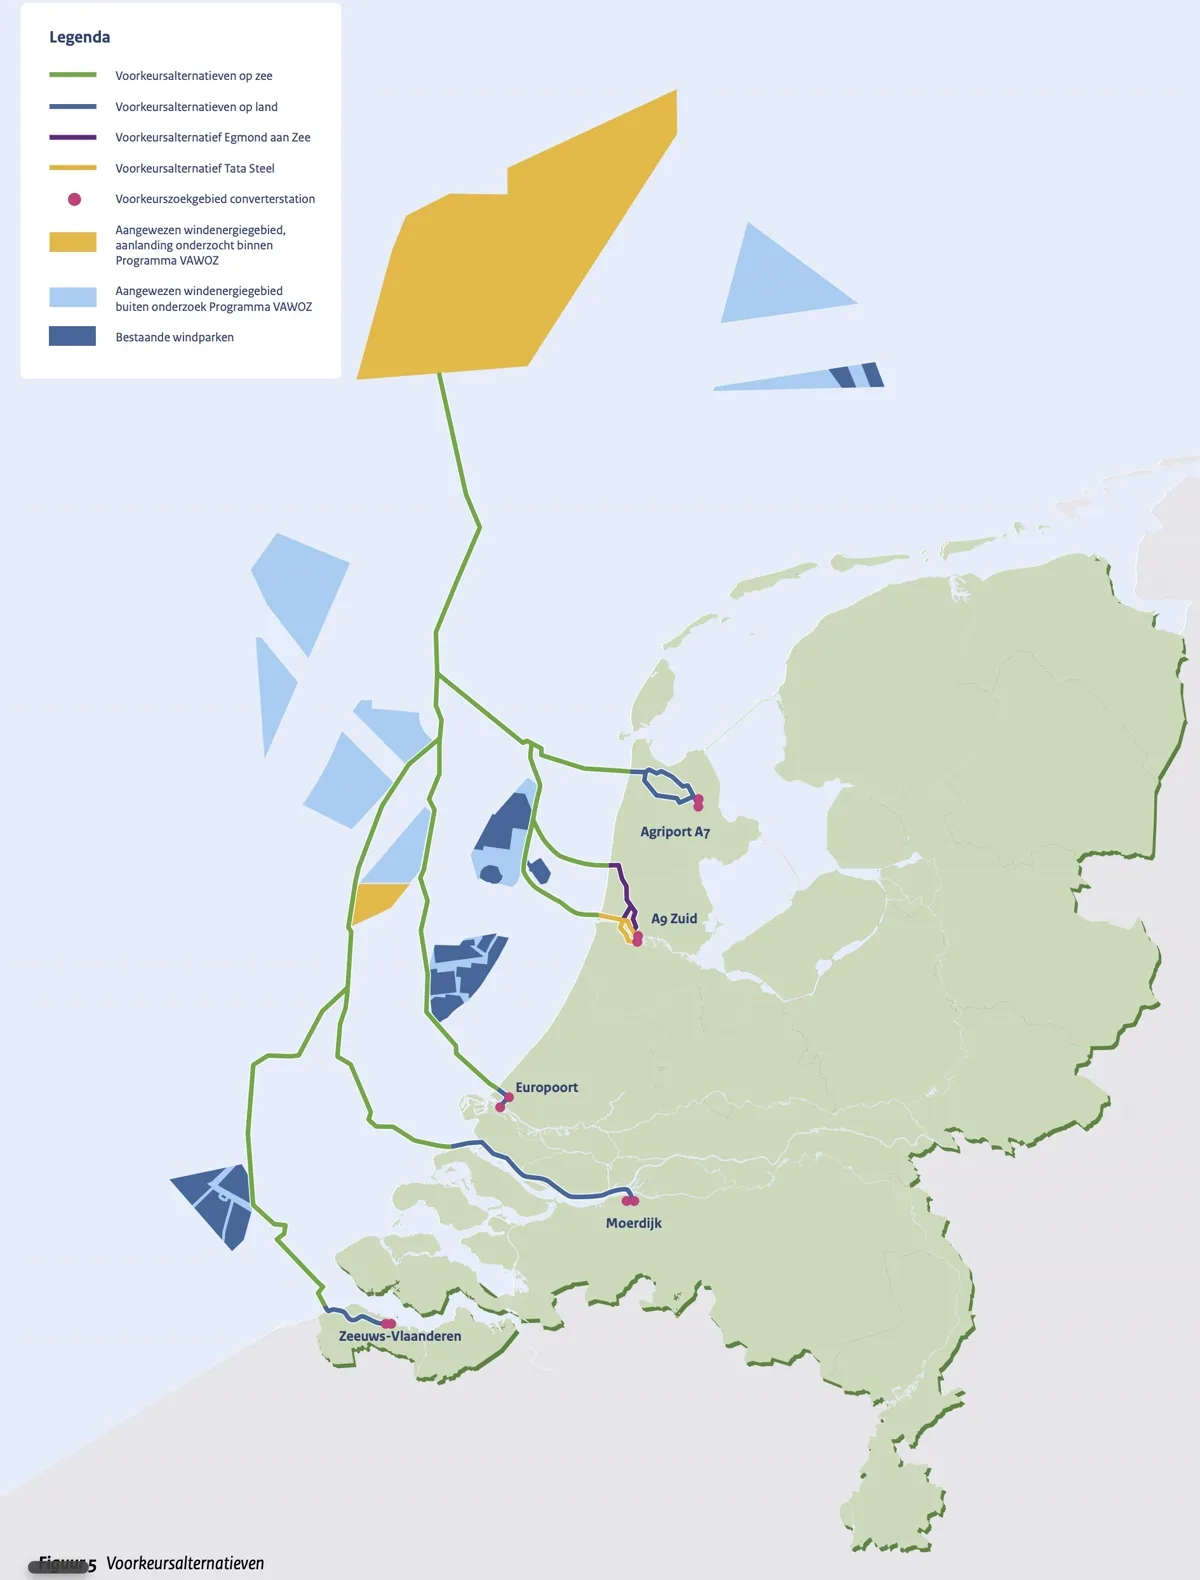
Offshore wind landing routes and converter stations, per scenario year
Built for decisions that depend on the grid
If your project's revenue or expansion hinges on a congested connection, BirdFlow gives you the numbers before you sign.
BESS developers
Considering a non-firm connection (ATO/TDTR)? BirdFlow shows how many hours you'll actually be restricted — and BESSview turns that into the revenue impact on your business case.
Datacenters
Waiting years for firm capacity isn't a plan. See the expected hourly restrictions at candidate locations through 2036 and design your power strategy — grid, batteries, on-site generation — on real numbers.
Industry
Electrifying or expanding on a congested grid? Quantify when and how often your offtake would be curtailed at each site — and what flexibility or storage would solve it.
What will the grid allow at your location?
Ask us for a BirdFlow analysis of your connection point — or let us walk you through the model on a live demo.