
Independent benchmarking of BESS optimizers
Birdview Energy measures what the party trading your battery delivered against what it could have earned on the same days, on the same grid connection. Independent, fully documented, and precise enough to sit behind a termination clause in a route-to-market contract.
Four separate products. A capture-ratio backtest of your own site and a managed optimizer tender are available today. A live head-to-head benchmark and a public optimizer ranking are being built.
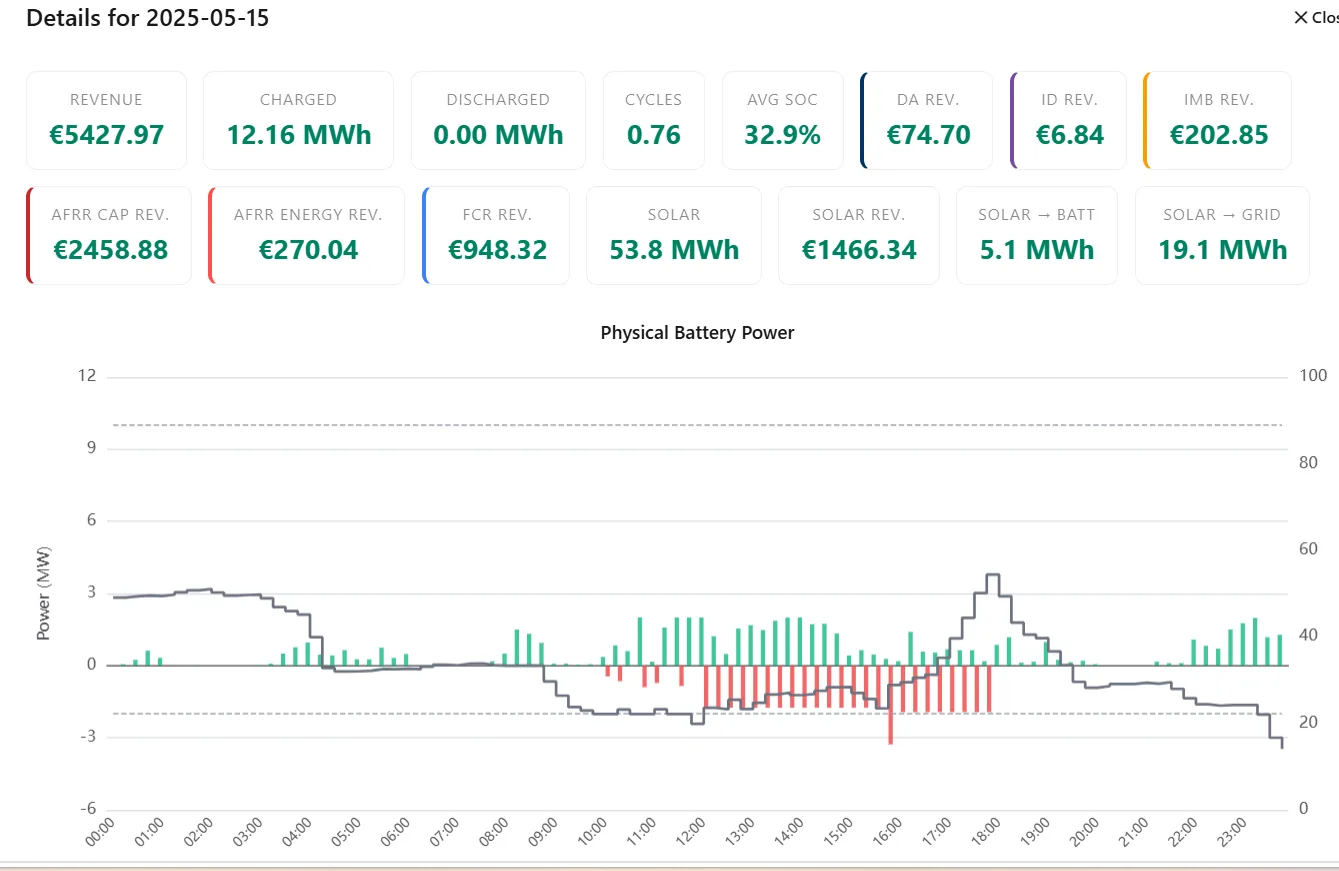
One day, fully decomposed: what was earned in each market, what the battery physically did, and what it cost in cycles
A trading report cannot check itself
Optimizer performance is reported by the optimizer, after the month has settled, against its own view of what was achievable. The numbers may well be right. From the outside there is no way to tell.
Scored by the party being scored
The party being judged computes the score, after settlement, with full hindsight over what the market turned out to do. Every difficult month comes with an explanation attached.
No counterfactual
A weak market and a weak optimizer produce the same P&L statement. Without a second party trading the same asset on the same days, the two are indistinguishable.
Switching is a leap
Choosing a different optimizer means trusting a deck about somebody else's batteries, on somebody else's grid connection, in a period they selected.
Four ways to benchmark
Different questions need different evidence, so we keep them separate instead of blurring them into one number.
Live head-to-head benchmark
Optimizers stream their trading signals to us as they are issued. We timestamp and seal each one on arrival, then score every party against the same asset, the same prices and the same constraints. Challengers can trade your battery on paper, in parallel, without ever touching it.
For: owners choosing between optimizers, and optimizers who want an independently verified track record.
Public optimizer benchmark
A published comparison of how three to five of the largest optimizers are currently performing on the Dutch market. None of them commissions it or funds it. It is a standing reference rather than a private report.
For: anyone who wants to know where the field actually stands before running a process of their own.
Capture-ratio backtest
A backtest of your specific site: what it could have earned, and what share of that your current optimizer captured. The model is your site, so co-located PV or industrial load and the offtake and feed-in limits of your own connection are covered, non-firm and flexible contracts included.
For: owners of an operating asset who want to know what is being left on the table. See a worked example below.
Optimizer tender
We run the whole selection process: define the asset and its constraints, put the same measurable question to every bidder, score the responses on one published method, and hand over a comparison with the workings attached.
For: owners going to market for a route-to-market partner.
A and B score decisions as they are made. C works backwards from what the market actually did. The method below describes A, the live benchmark; the worked example that follows it is real output from C.
The method
Four steps, in a fixed order. A decision has to be on record before the market resolves it, or it proves nothing.
Signals arrive live
Your optimizer posts every trading signal to our API as it is issued: day-ahead volumes, intraday positions, reserve bids, real-time setpoints. Each one lands with the timestamp it arrived, not the timestamp it claims.
We seal them
Signals are written once and never rewritten. A signal for a delivery period is locked before that period begins. Whatever the market does next, the decision on record is the decision that was actually taken.
Challengers trade in parallel
Competing optimizers subscribe to the same live asset state and the same market feed, and send their own signals at the same time. Nothing they send touches your battery. They are trading your asset on paper, live.
We settle and score
Once delivery has passed, every set of signals is replayed against realized prices and your real state of charge, power rating and grid limits, then held against the achievable-revenue benchmark for the same days.
What "achievable" means, exactly
The revenue your specific asset could have earned: optimal dispatch simulated in BESSview across the Dutch wholesale and balancing markets, with your battery's technical parameters and the constraints of your connection agreement. No perfect foresight, and no comparison against published sector averages.
A benchmark built on prices alone always beats a real trader, because it ignores whether a trade could have been filled. Ours runs a feasible trading algorithm against the intraday order book, so every euro in it was there to take.
The full optimization methodology is documented and handed over. Both sides can read exactly how the number was produced before either of them agrees to be measured by it.
What goes into the reference
- Your asset, not a generic one. Power rating, capacity, round-trip efficiency, degradation per cycle, cycle budget, SOC window and availability.
- Your grid connection. Grid parameters and constraints taken from the connection agreement, including non-firm and flexible contracts.
- Every relevant market. Reported per individual market and cross-optimized across all of them together.
- Executable fills. Priced against the intraday order book, so the benchmark reflects trades that could have been filled rather than prices that were merely printed.
- A monthly cadence. Benchmark revenue is produced every month, so performance is visible while the contract still has time to run.
What makes it independent
Birdview does not trade, does not steer assets and does not take a share of trading revenue. The benchmark is the product, so there is nothing to gain from any particular party winning it.
- Signals are timestamped by us on arrival and stored write-once
- Every participant gets the same asset state and market data, at the same moment
- No participant sees another's signals, during the test or afterwards
- Late or missing signals are scored as what they are, not quietly dropped
- The same constraints bind everyone: your SOC, your power rating, your grid limit
- The scoring method is published, and identical for the incumbent and every challenger
A worked example
A 10 MW / 40 MWh battery on the Dutch wholesale markets, benchmarked across the whole of 2025. This is the output the method produces, on real historical market data.
| Input parameters | Unit | |
|---|---|---|
| Power (PSC) | 10 | MW |
| Capacity | 40 | MWh |
| Round-trip efficiency | 86 | % |
| Degradation | 4 | % per 1000 cycles |
| Cycles budget | 2.0 | per day |
| Minimum SOC | 5 | % |
| Maximum SOC | 95 | % |
| BESS availability | 99 | % |
| Operational period | 2025 | calendar year |
| Benchmark revenue 2025 | k€ / MW |
|---|---|
| Day-ahead | 98.8 |
| Intraday | 91.5 |
| Imbalance | 43.6 |
| FCR capacity | not in this run |
| aFRR capacity | not in this run |
| aFRR energy | not in this run |
| Total, cross-optimized | 234 |
Wholesale markets only: day-ahead, IDA1/2/3, intraday continuous and imbalance, on 2025 historical Dutch market data. FCR and aFRR are excluded from this particular run rather than unavailable; the benchmark covers them when the asset is contracted to deliver them. The per-market figures are the allocation of a single jointly optimized dispatch, not three standalone strategies added together, which is why they sum to the cross-optimized total up to rounding. All figures in k€ per MW of power rating, the unit BESS revenue is quoted in; multiply by the 10 MW rating for whole-asset euros.
Executable revenue against the theoretical maximum
The same asset, the same year, run twice: once with perfect foresight, the ceiling no strategy can beat, and once with a feasible trading algorithm working the intraday order book. The ratio between them is the capture ratio.
Every month shows the same gap. A benchmark set at the perfect-foresight line would score any real trader as a failure.
This is why the reference matters more than the headline. Set the benchmark at 381 k€/MW and every optimizer on the market underperforms it in every month, so a termination clause written against it fires permanently and proves nothing. Set it at 234 k€/MW, the revenue a feasible strategy could actually have executed, and the comparison starts to mean something.
The capture ratio is also the number that travels between assets. Revenue in euro depends on how volatile the year was; the share of the achievable maximum that was captured is a statement about the trading, which is the thing you are actually paying for.
What happens when the ancillary markets are added
The same asset and the same year, re-run with aFRR and FCR capacity available and at most half the power allowed to be committed to them. The total goes up. What is instructive is how little, and where it comes from.
| Market (k€ / MW) | Wholesale only | With ancillary |
|---|---|---|
| Day-ahead | 98.8 | 40.4 |
| Intraday | 91.5 | 41.2 |
| Imbalance | 43.6 | 44.9 |
| Ancillary services (aFRR and FCR capacity) | not in this run | 132.8 |
| Total, cross-optimized | 234.0 | 259.4 |
| Capture ratio against the maximum | 61% | 64% |
All figures in k€ per MW for the 2025 calendar year, 10 MW / 40 MWh, 2.0 cycles per day. In the ancillary run at most 50% of the power rating may be committed to reserve markets. Each capture ratio is measured against the perfect-foresight maximum for that same configuration: 381.3 k€/MW for wholesale only and 405.5 k€/MW with ancillary included.
Adding two entire markets worth 132.8 k€/MW lifts the annual total by 25.4 k€/MW, which is 11%. Day-ahead revenue falls by 59% and intraday by 55% at the same time. The reserve markets did not add to the stack so much as take it over.
The reason is physical rather than commercial. Power committed to a reserve market has to stay available, so it cannot be cycled for arbitrage, and energy held in reserve to honour a bid is energy unavailable to trade. Capacity is the scarce resource, and every market is bidding for the same megawatts.
This is the case for cross-optimizing instead of adding up per-market studies. The wholesale run made 234.0 k€/MW and the reserve markets 132.8 in theirs; added up that promises 366.8 k€/MW, but the jointly optimized answer is 259.4. The missing 107.4 k€/MW is megawatts counted twice.
One day, fully decomposed
The annual figure is only credible if it can be taken apart. Every day in the benchmark resolves to the trades that produced it: what was earned in each market, what the battery physically did, and what it cost in cycles.
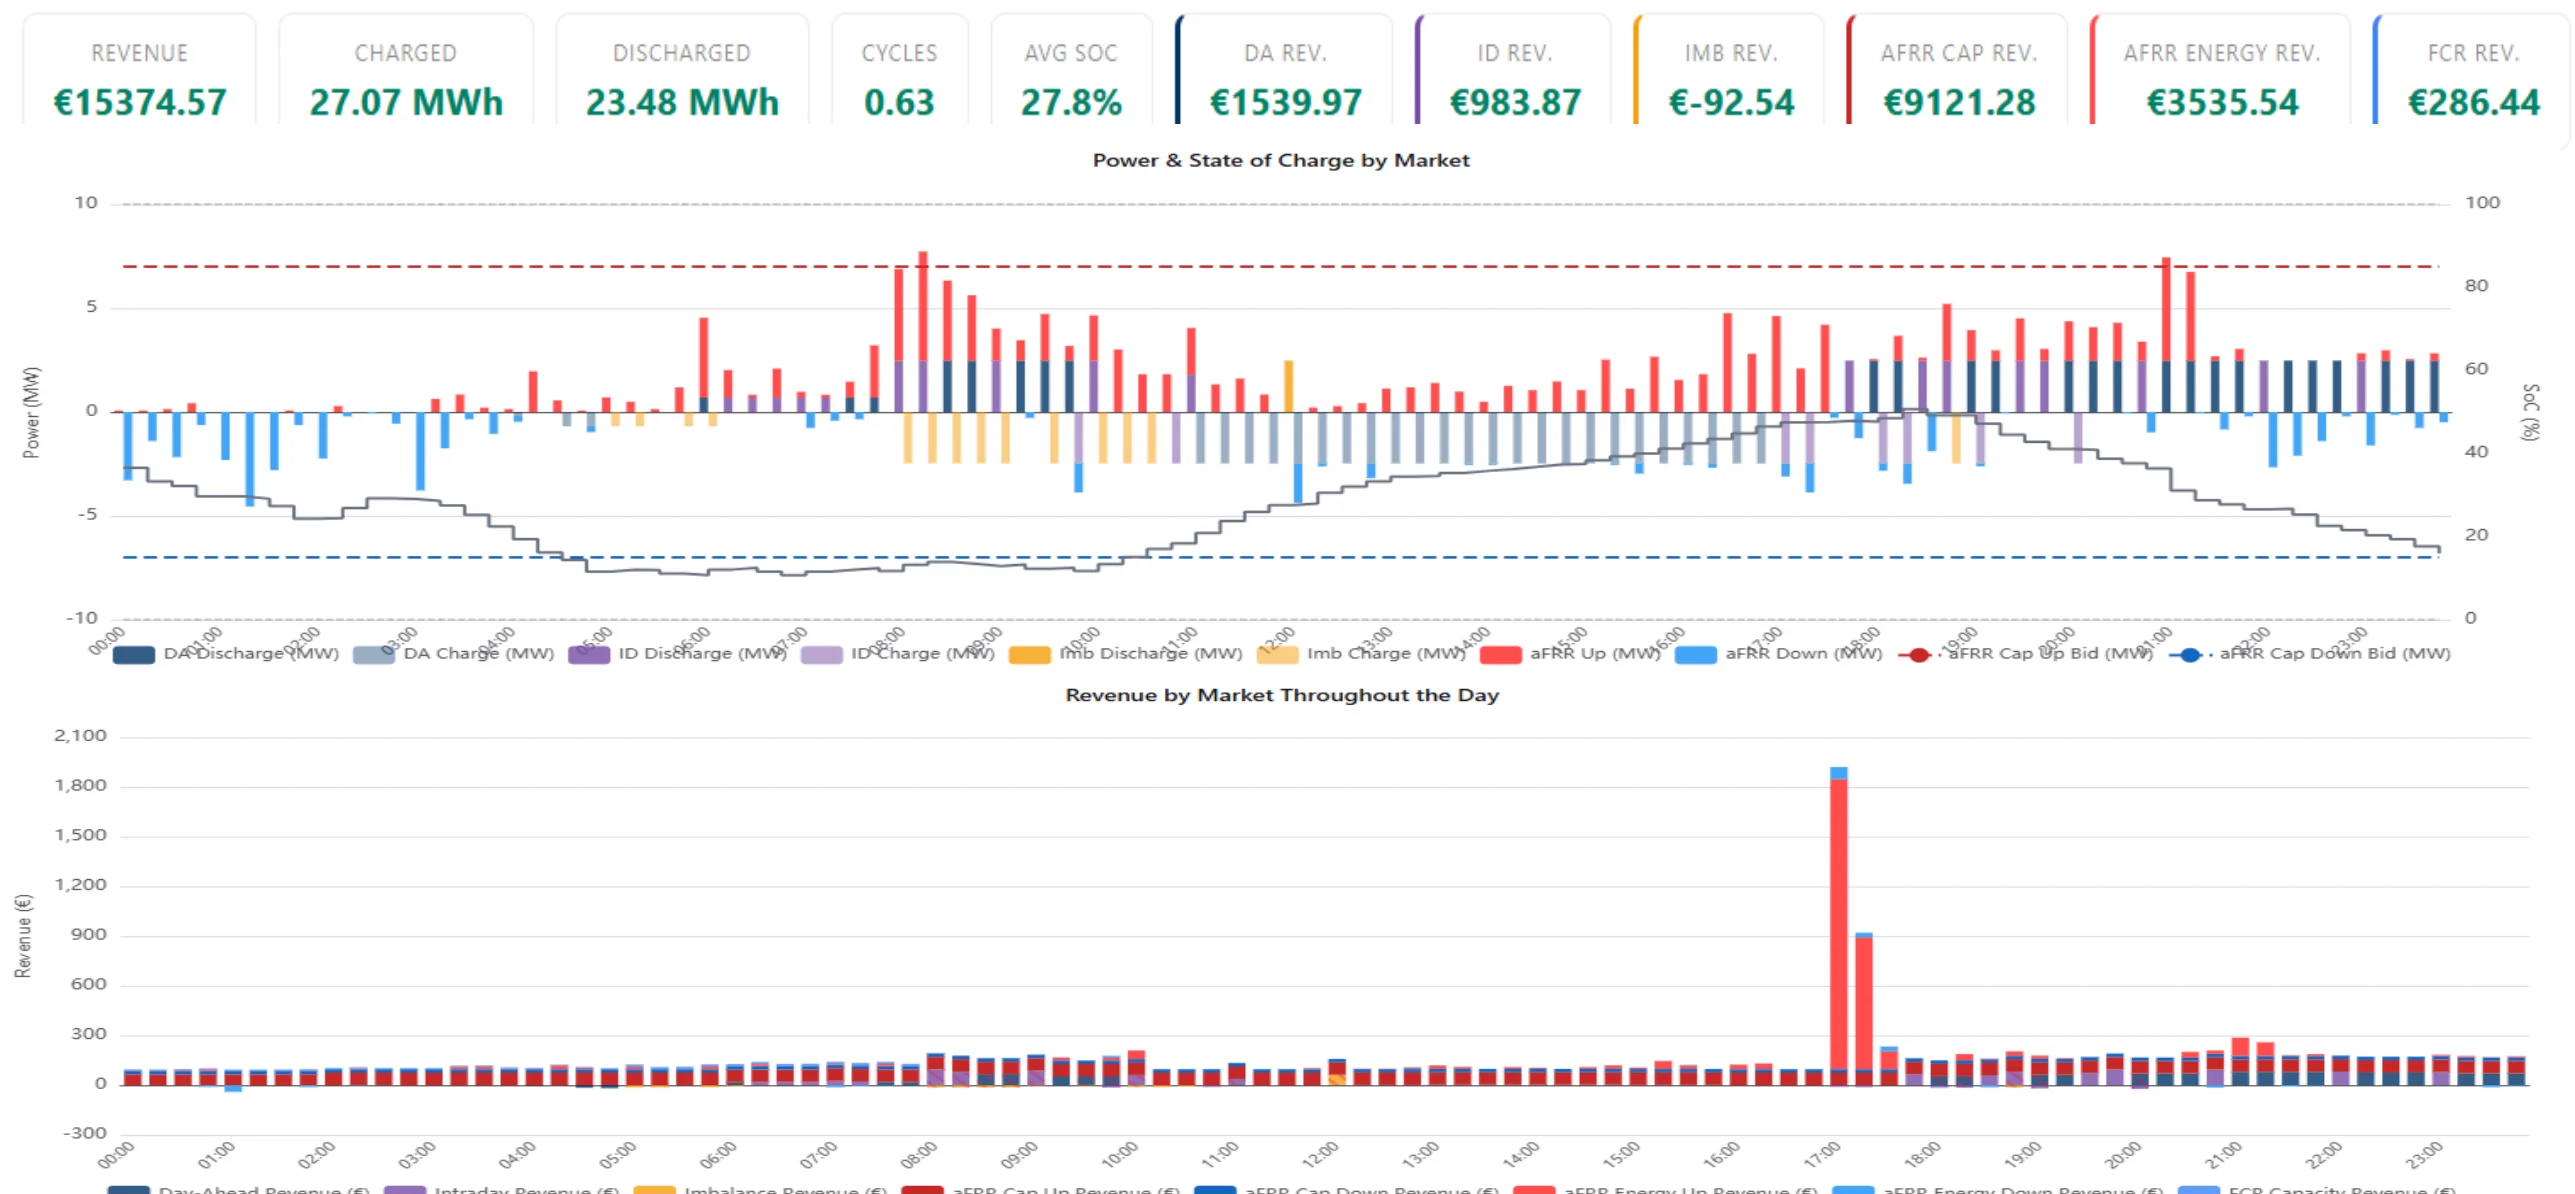
This is what makes the benchmark contract-grade rather than indicative. When a number is going to sit in a route-to-market agreement, both parties need to be able to audit it, and an annual total that cannot be traced to individual quarter-hours is not auditable.
It is also how the reward-against-risk view further down is built. Once every day is decomposed, the days can be sorted by how strong the market was, and performance in a flat market can be separated from performance in a volatile one.
Written into the contract itself
A performance number is only worth as much as the consequence attached to it. Because the benchmark is independent, reproducible and documented, it can be referenced directly inside a route-to-market, tolling or floor agreement as the performance metric behind a termination clause.
Both sides adopt the same reference before the period starts. The asset configuration, the grid constraints and the optimization methodology are agreed up front, by the owner and the offtaker together. Monthly benchmark revenue is then produced per market and cross-optimized, and measured performance against it is what triggers the clause.
Because the asset, the constraints and the method are fixed up front, there is nothing left to define when the term ends.
Why it holds up in an agreement
- Produced by a third party with no stake in which side wins
- Fully transparent optimization methodology, documented and handed over
- Reproducible: same asset, same period, same inputs, same number
- Monthly, so a failing arrangement is visible long before the term ends
- Specific to your asset and your connection, so neither side can call it unrepresentative
Birdview provides the benchmark and its methodology. Drafting the clause itself stays with your legal counsel.
Try a different optimizer without switching anything
A dry test is a challenger trading your battery on paper, in real time, while your current optimizer keeps full control of the physical asset. The challenger sees the same state of charge, the same grid limit and the same prices, at the same second. It just cannot move anything.
After a few weeks you stop arguing about whose backtest is more realistic, because there is no backtest. There is a period of real market conditions on your own asset, traded by both parties at the same time, scored the same way.
Run one challenger or five. Run them for a month before a contract renewal, or continuously as a standing check on the party you already use.
If you own the asset
You find out what your battery would have earned in someone else's hands, on the days you actually had, before you renegotiate or switch. The cost of a mediocre optimizer stops being a suspicion and becomes a number.
- No operational risk: challengers never touch the battery
- No contract to break before you have evidence
- An independent, factual basis for the renewal conversation
If you are an optimizer
You get to prove performance on a real asset in a real market without first persuading someone to hand over their battery. A dry test is a track record you did not have to win a tender to start building.
- Verified by a third party, not by your own report
- Your strategy stays yours: we score signals, we do not inspect models
- A way into assets whose owners will not run a live pilot
Where the field actually stands
The private benchmarks answer a question about one asset. The public benchmark answers a question about the market: how are the largest optimizers actually performing right now, measured the same way, on the same reference asset, over the same period.
We are preparing a standing comparison of three to five of the largest optimizers active on the Dutch market. Nobody pays to be included and nobody pays to be left out. Birdview does not trade, does not steer assets and takes no share of trading revenue, so there is no participant whose result is worth anything to us.
Today an owner comparing optimizers has vendor decks and word of mouth. A published reference, produced by the same scoring pipeline as the contract benchmarks, gives the market one yardstick and gives the genuinely good optimizers somewhere to demonstrate it.
What separates it from a market survey
- Nothing self-reported. Every figure comes from our scoring.
- One reference asset. The same battery, grid limit and period for everyone, so the comparison is not between different assets in different years.
- Capture ratio, not raw revenue. Results are expressed against the achievable maximum, so a volatile quarter does not flatter everybody at once.
- Published method. The scoring is documented before the results appear.
If you optimize a portfolio of batteries in the Netherlands and want to be in the first round, get in touch.
Running the whole selection process
Going to market for a route-to-market partner is mostly a comparability problem. Every bidder answers a slightly different question, in their own format, on their own reference period. We remove that.
Define the asset
Technical parameters, the connection agreement and its limits, any co-located generation or load, and which markets are in scope. The constraints are fixed before anyone bids.
Ask one question
Every bidder receives the same asset, the same period and the same required outputs, so responses are comparable.
Score on one method
Responses are scored against the achievable maximum for your asset, using the same published method as the benchmark, including the days when the market was flat.
Hand over the evidence
A comparison with the workings attached, so every score can be traced back to the signals behind it, plus the benchmark clause language if the contract is going to reference it.
Decide on measured performance
A tender can end with a shortlist trading your asset on paper, in parallel, for a month. Nobody touches the battery, everybody is scored the same way, and the decision rests on what the candidates actually did.
Talk to us about a tender ->What we score
Six families of metrics. Revenue is only the first, and on its own it is the easiest one to explain away.
| Metric | What we measure | What it tells you |
|---|---|---|
| Financial performance | Realized revenue per MW per year, split by market (day-ahead, intraday, imbalance, aFRR, FCR), against the achievable-revenue benchmark for the same asset on the same days. | Whether a disappointing quarter came from the market or from the party trading in it. |
| Trading mistakes | Signals that lost money against the information available when they were sent: wrong-side trades, spreads left on the table, positions closed late, reserve bids that clash with the energy position. | Mistakes are countable and they repeat. A single unlucky day does not. |
| Feasible bids | The share of submitted bids the asset could physically have delivered, given state of charge, power rating, ramp rate and the grid limit in force at that moment. | A bid the battery cannot honour is a penalty, or a reserve payment clawed back, waiting to happen. |
| Forecast performance | The price forecast implied by each optimizer's positions, scored against realized prices per market and per horizon. | Revenue follows the forecast. A weak model can hide behind a volatile month, but not behind its own forecast error. |
| Weak and strong market days | Every metric reported separately for the least and most volatile thirds of the period, instead of one blended average. | Almost anyone earns on a volatile day. What an optimizer does on a flat one is the floor you actually live on. |
| Reward against risk | Return per unit of risk taken: imbalance exposure, open position size, and how much of the profit is concentrated in a handful of days. | Separates skill from leverage. Two identical revenue numbers can carry very different downside. |
Each metric is reported for your live optimizer and for every dry-test challenger, computed the same way from the same sealed signals.
Separating an edge from a good month
Splitting performance by how strong the market was is what separates an optimizer with an edge from one with a tolerance for volatility.
Illustrative shape of the reward-against-risk report. Real figures come from your own asset, once it is running in the benchmark.
Read the chart above from left to right rather than by the totals. Challenger B posts the best single number anywhere on it, 88% on the most volatile days, and is the worst of the three when the market is flat. That is a position taker: the strategy is long volatility, and in a calm quarter it gives most of the gain back.
Challenger A never wins by as much, and never collapses either. On a blended average across the whole period the two can land within a point of each other, which is exactly why a blended average is the wrong number to sign a contract on.
The same logic applies to how profit is distributed in time. Revenue earned across a hundred ordinary days is underwritable. The same revenue earned on four days is a bet that paid, and next quarter it is the same bet.
Who the benchmark is for
Anyone whose money depends on how well a battery is traded, and who currently has to take that on trust.
Asset owners and operators
Find out what your battery is really earning against what it could have earned, and walk into the contract renewal with a number instead of a hunch.
Optimizers and suppliers
Build an independently verified track record on real assets, and compete on measured performance rather than on the persuasiveness of a backtest.
Lenders and financiers
Underwrite the revenue assumption alongside the asset. Route-to-market performance becomes a monitored, evidenced line item instead of a counterparty you hope is good.
The live benchmark in one diagram
Where the signals go, who settles them, and what the scorecard is measured against.
Every party sends into the same vault, under the same clock. Nothing leaves the vault until delivery has passed, and no participant ever sees another's signals.
Find out what your battery is actually earning
Send us your asset configuration and connection agreement and we will benchmark it against what the Dutch markets made possible over the period you choose. If you want the live signal capture and parallel dry tests as well, those are being built now, and we are looking for the first assets and optimizers to run them.