Platform for BESS & co-located investment decisions

Know your revenues and grid risks before you commit capital

Model standalone BESS, solar+storage, and wind+storage economics in one platform. Set up in one day, evaluate scenarios in minutes.

Multi-market revenue stacking Grid congestion & curtailment risk PDF reports for lenders and financiers
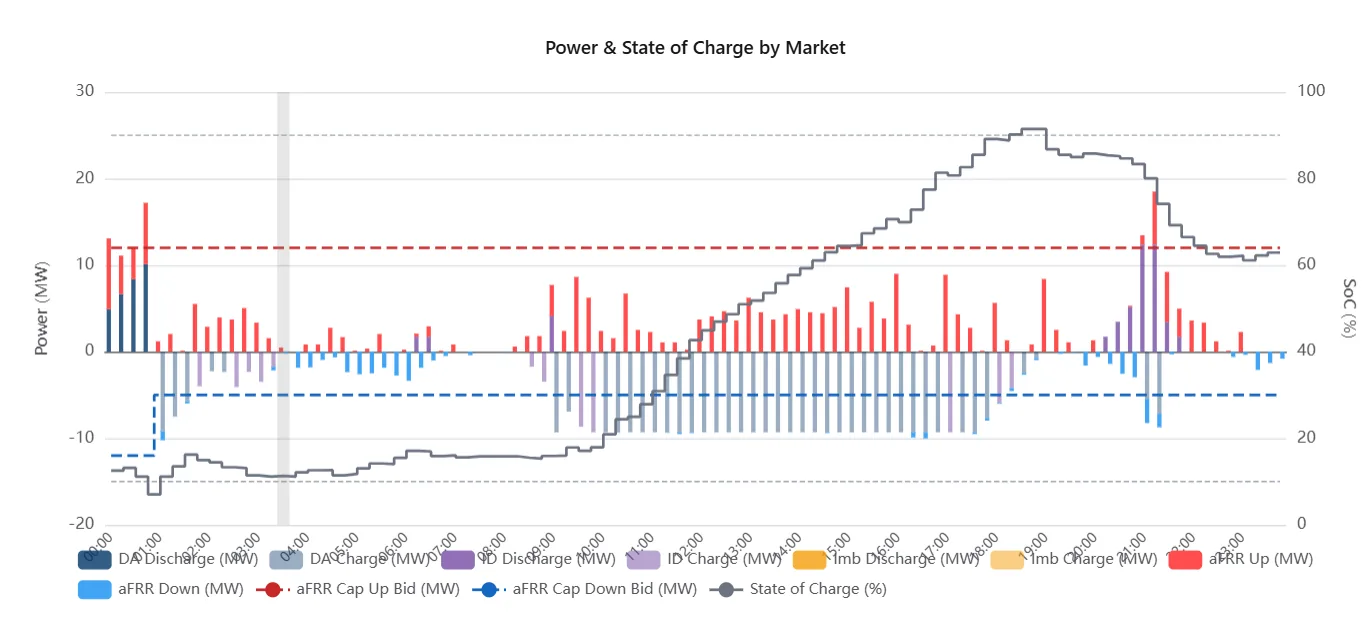
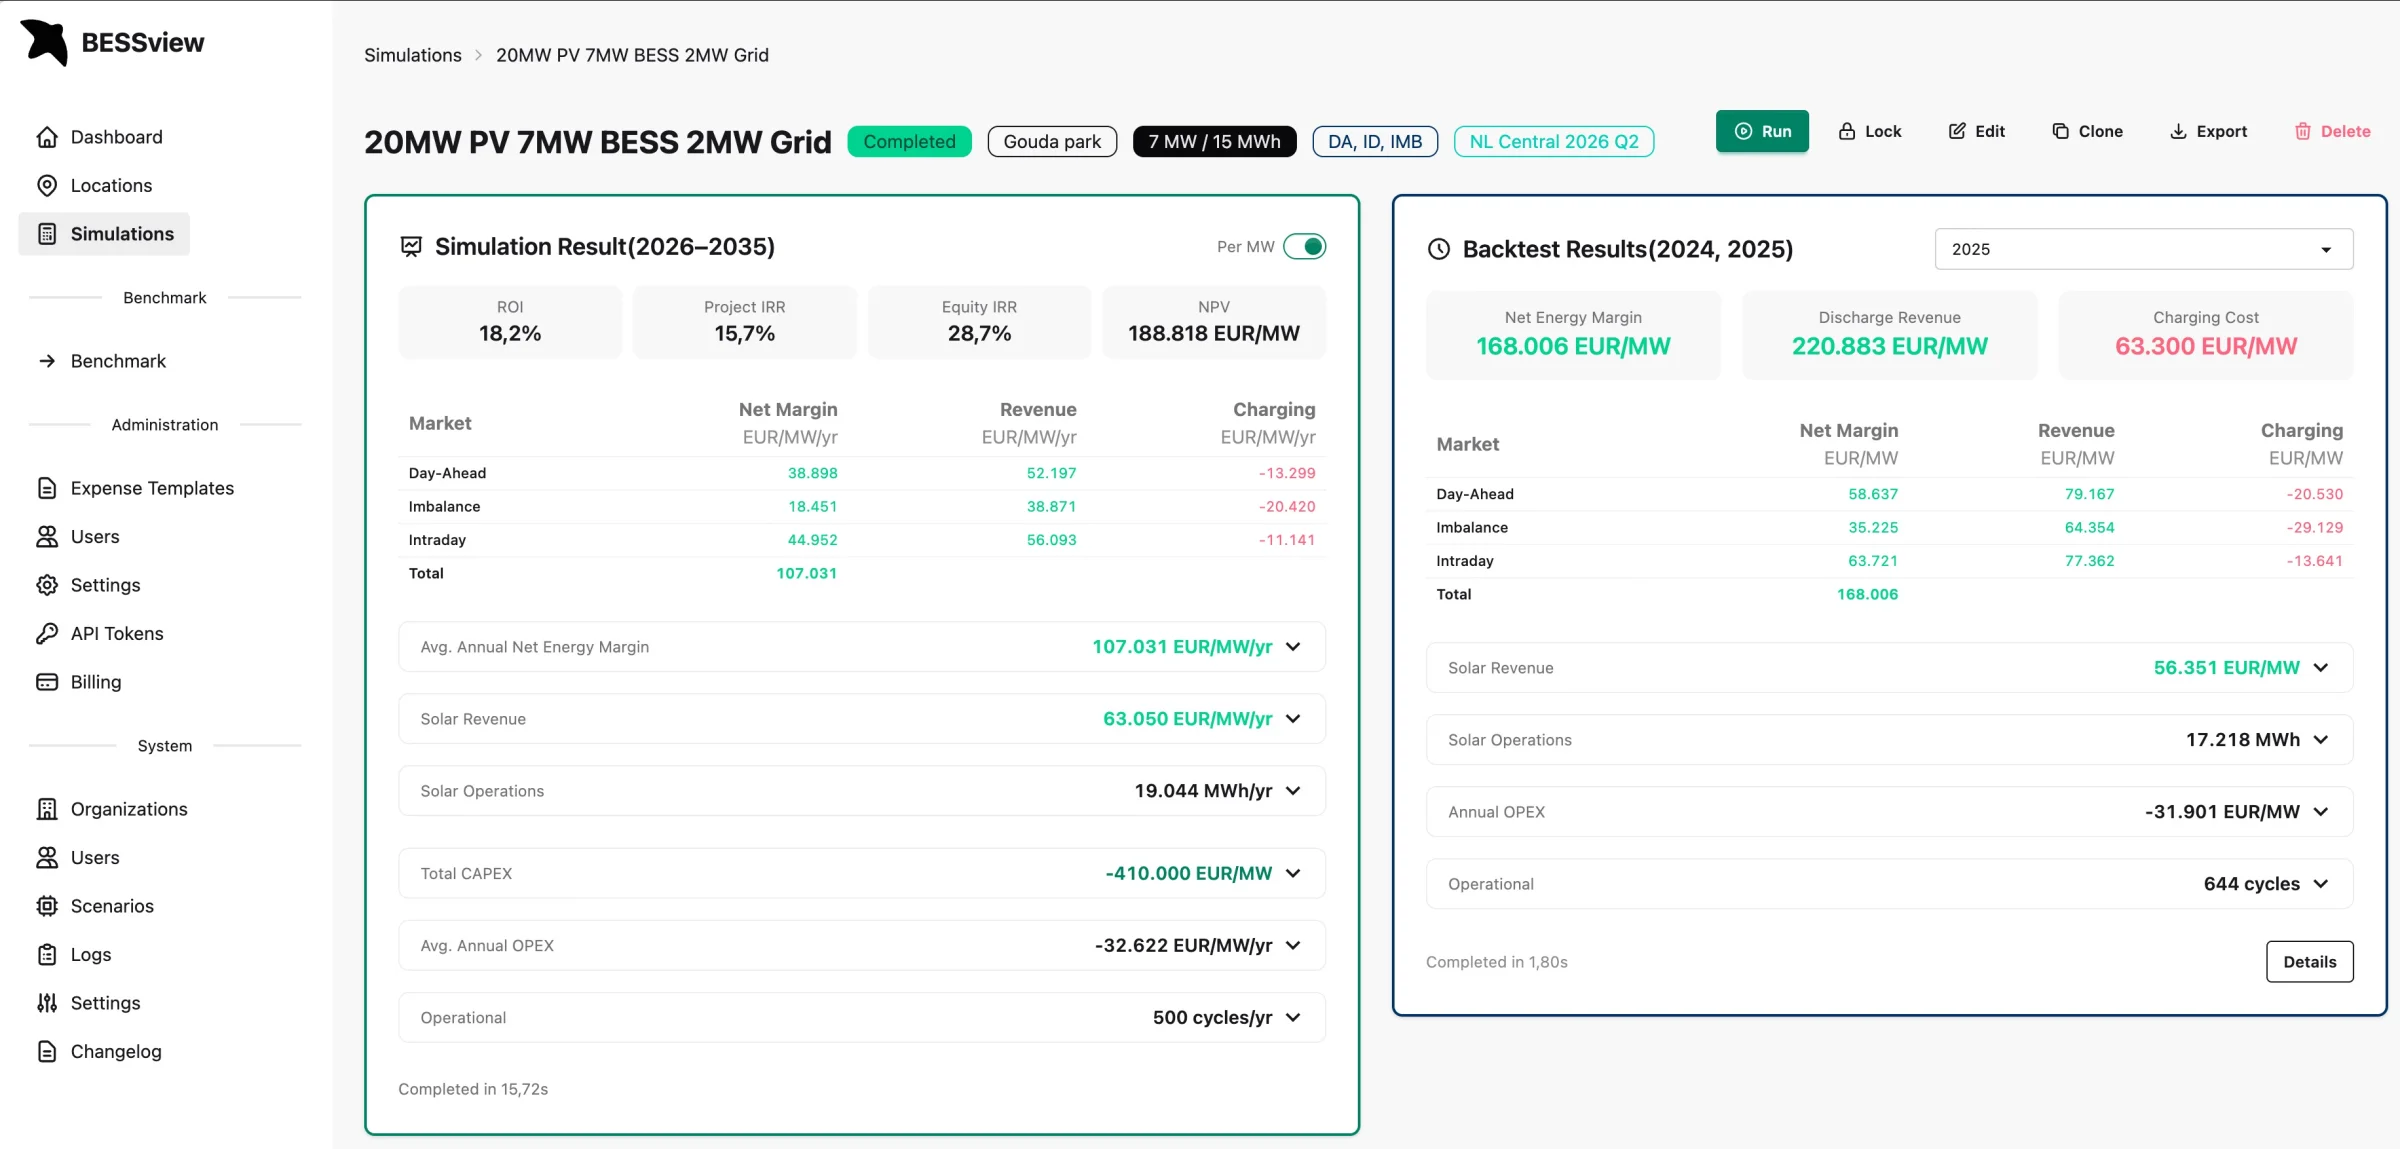
BESSview simulation results for a 20 MW PV and 7 MW / 15 MWh battery project on a 2 MW grid connection. The left panel lists ROI, project and equity IRR, NPV, and net margin per market. The right panel lists the 2025 backtest: realized net energy margin, discharge revenue and charging cost.
1 day
From data to live model
5
Markets stacked: DA, ID, FCR, aFRR, imbalance
3 countries
NL · DE · RO, and expanding
30 min
Demo with sample output

One platform, four products

Price curves, grid restrictions, business case, optimizer performance. Four separate products, all reading the same market data and the same scenario set.

Forward price curves

BirdCurve

Forward price curves to 2050, at 15-minute resolution, for every market a battery earns in. One consistent scenario set behind all your revenue assumptions.

  • Horizon to 2050 at 15-minute resolution
  • Covers all relevant markets: day-ahead, intraday, imbalance, aFRR and FCR
  • Internally consistent across markets, no mixing of sources with conflicting assumptions
  • Plugs straight into BESSview for multi-market revenue stacking business cases
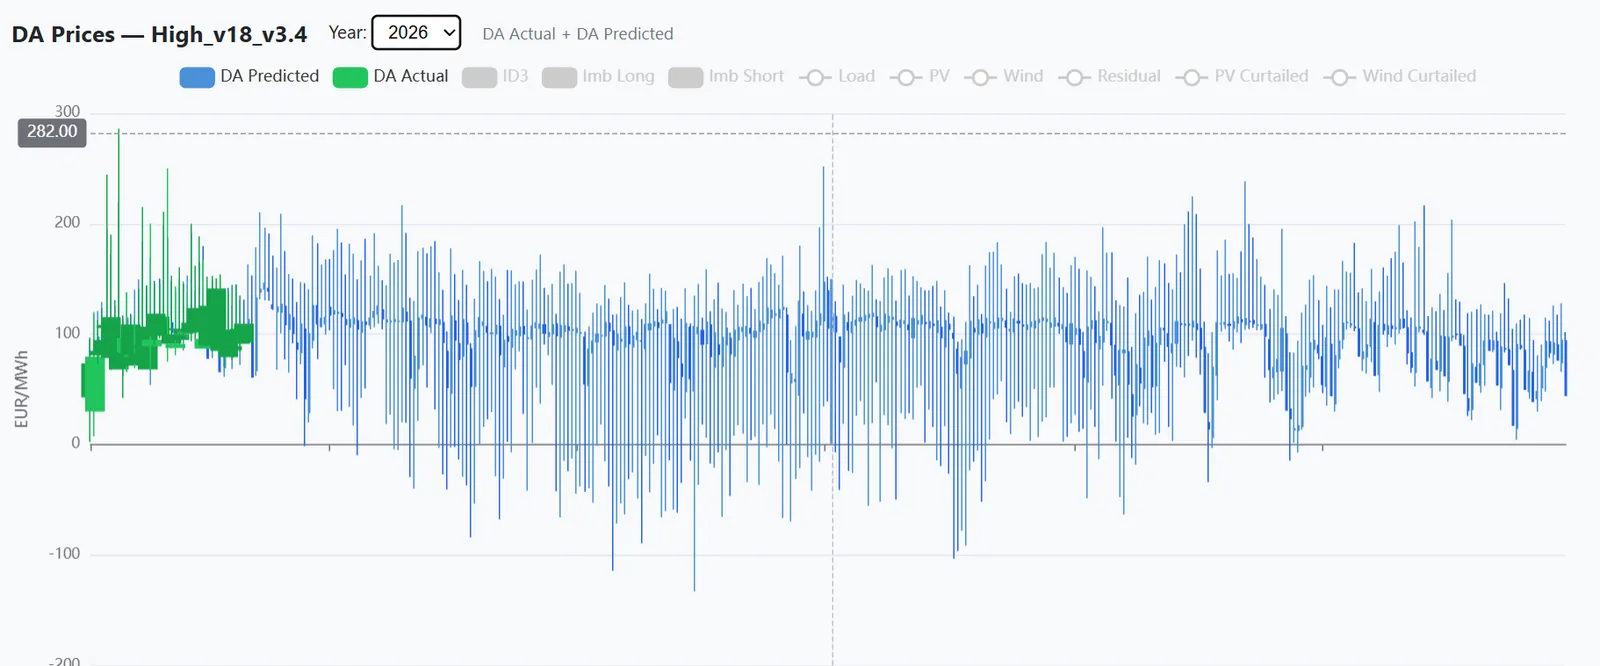
BirdCurve forward price curves
Sizing and revenue simulation

BESSview

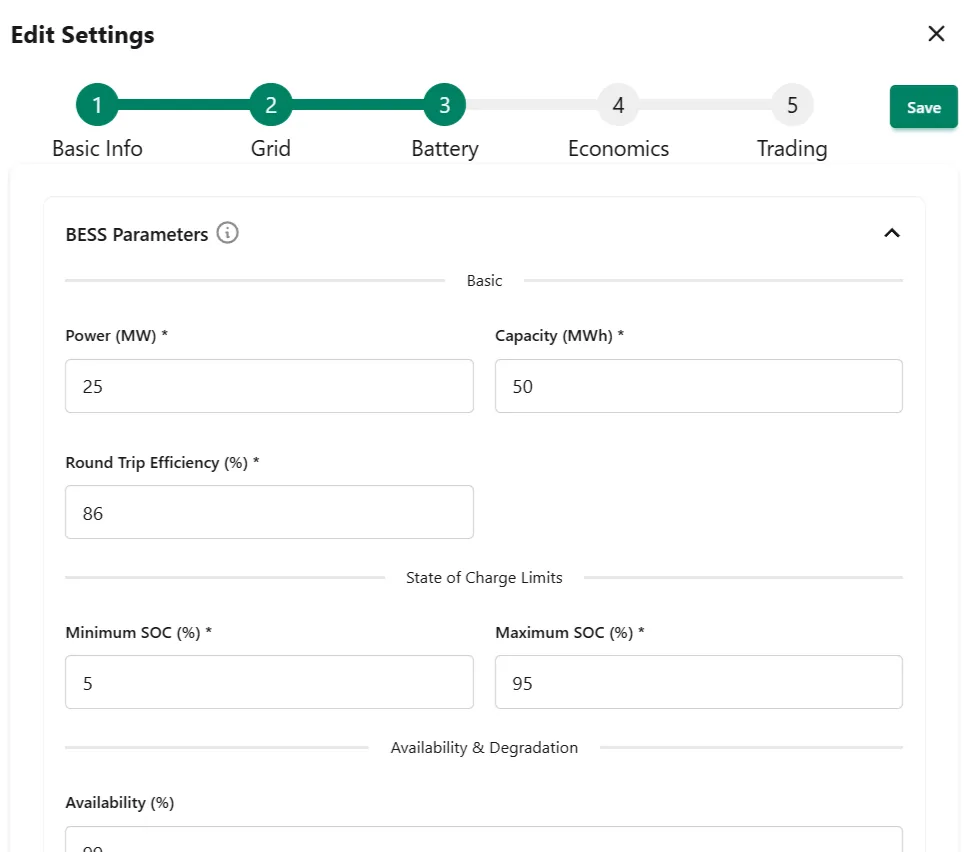
Sizing and revenue simulation for standalone and co-located BESS. BESSview optimizes dispatch on real time series, including the grid limitations, tariffs and losses that make or break the case.

  • Handles time-series grid limitations and flex tariffs (non-firm capacity)
  • Optimizes including kWmax, grid tariffs and energy tax
  • LFP degradation and round-trip efficiency (RTE) losses modelled explicitly
  • Standalone, solar+storage and wind+storage co-location
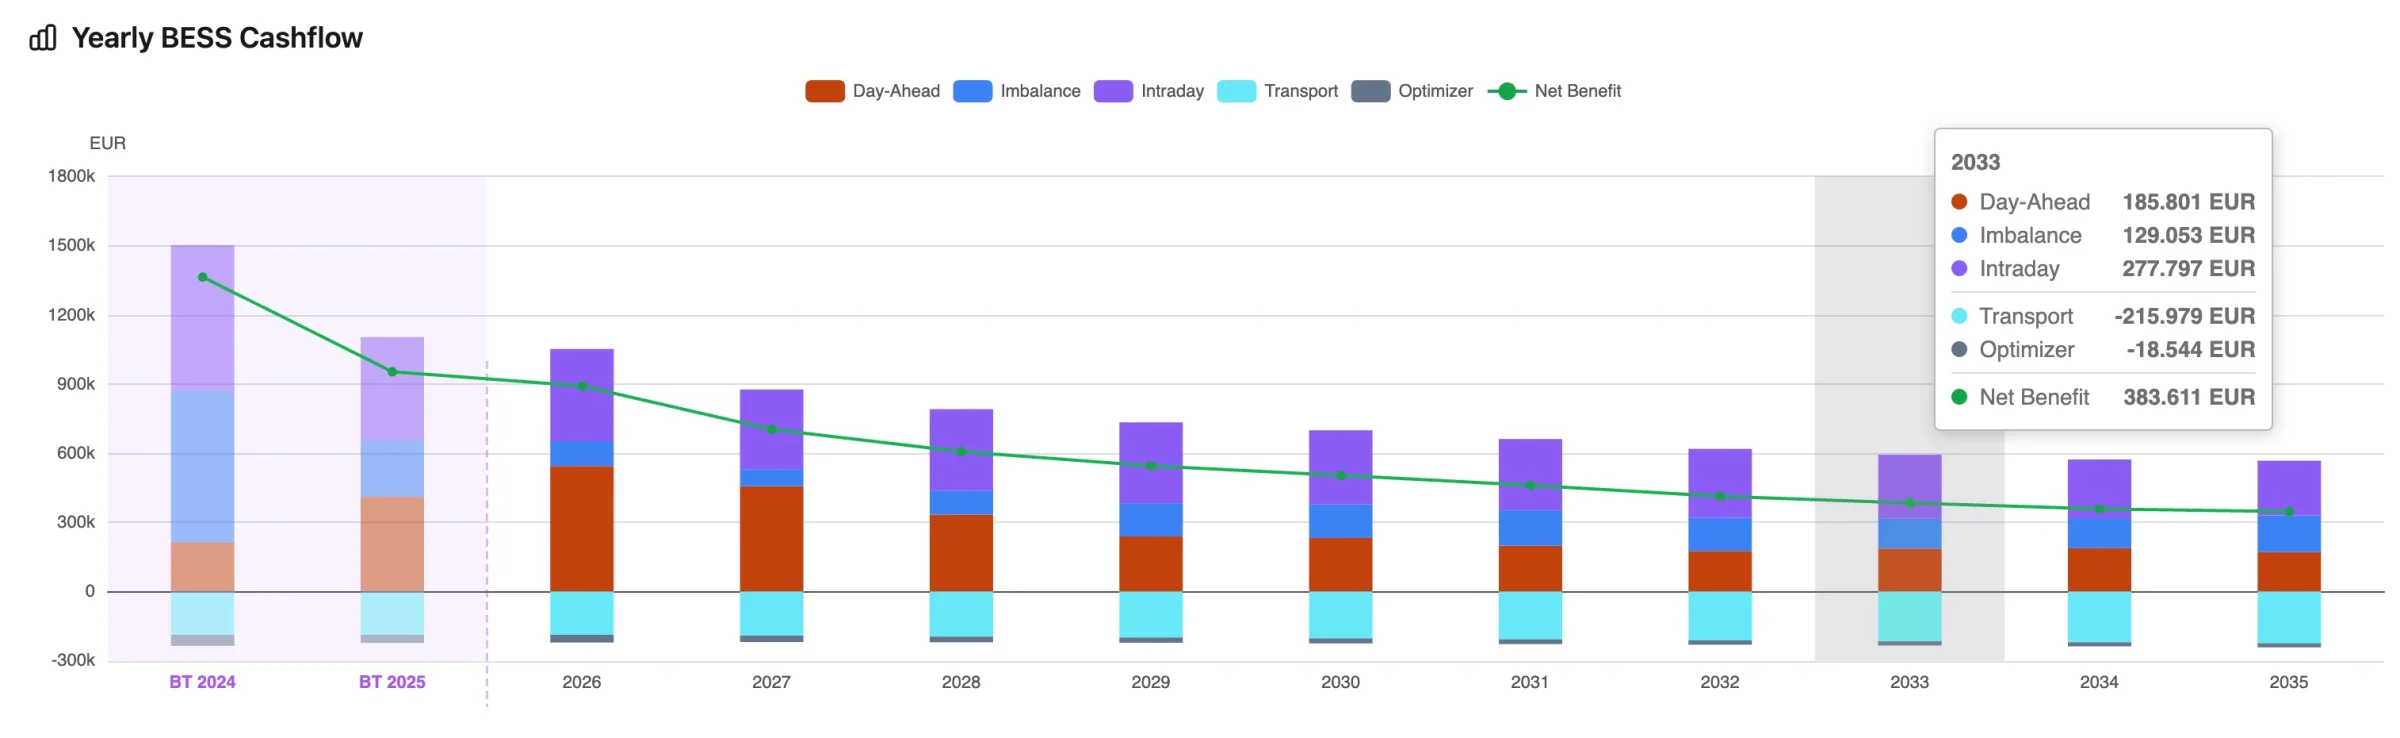
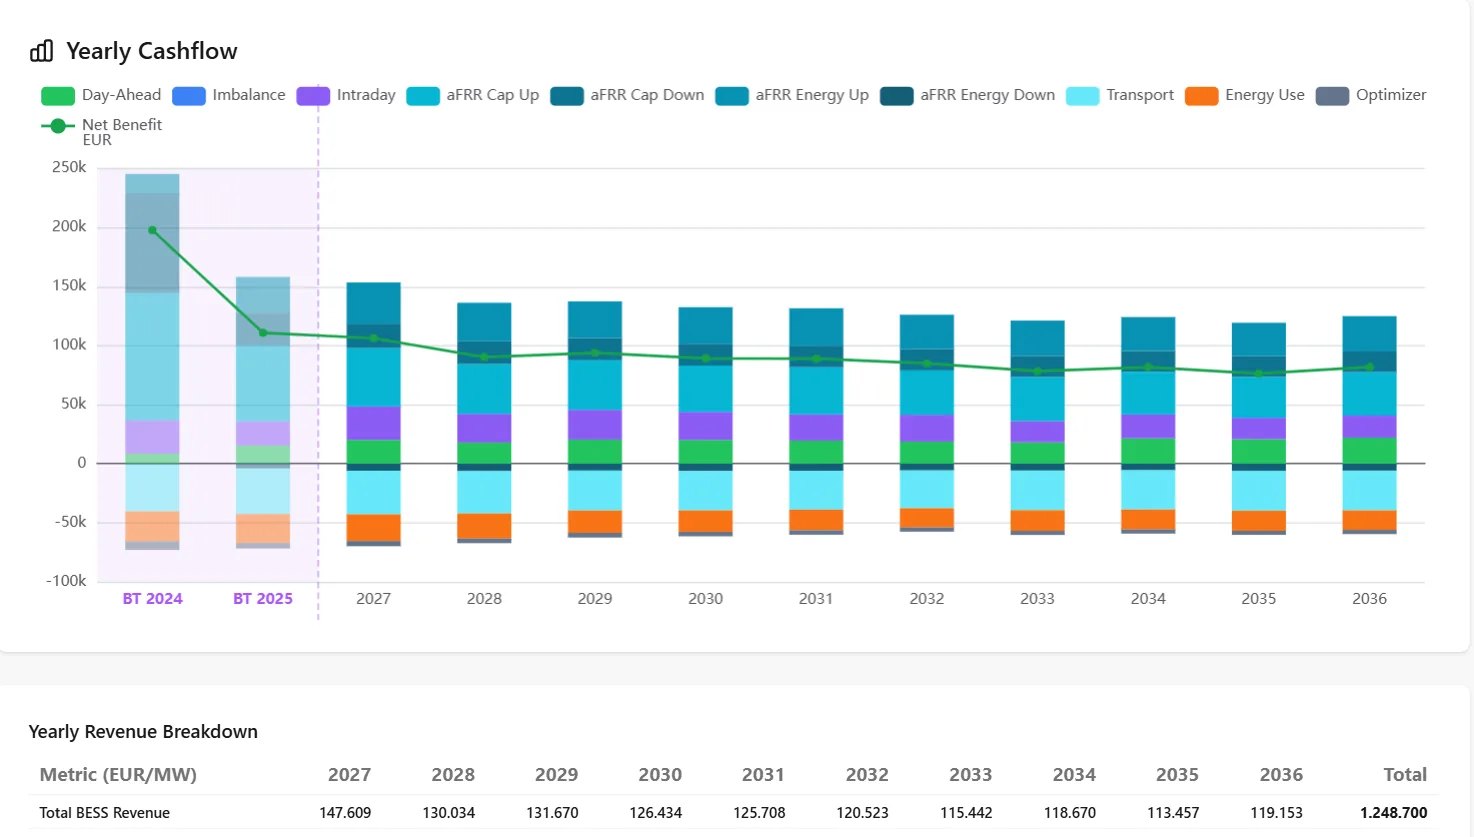
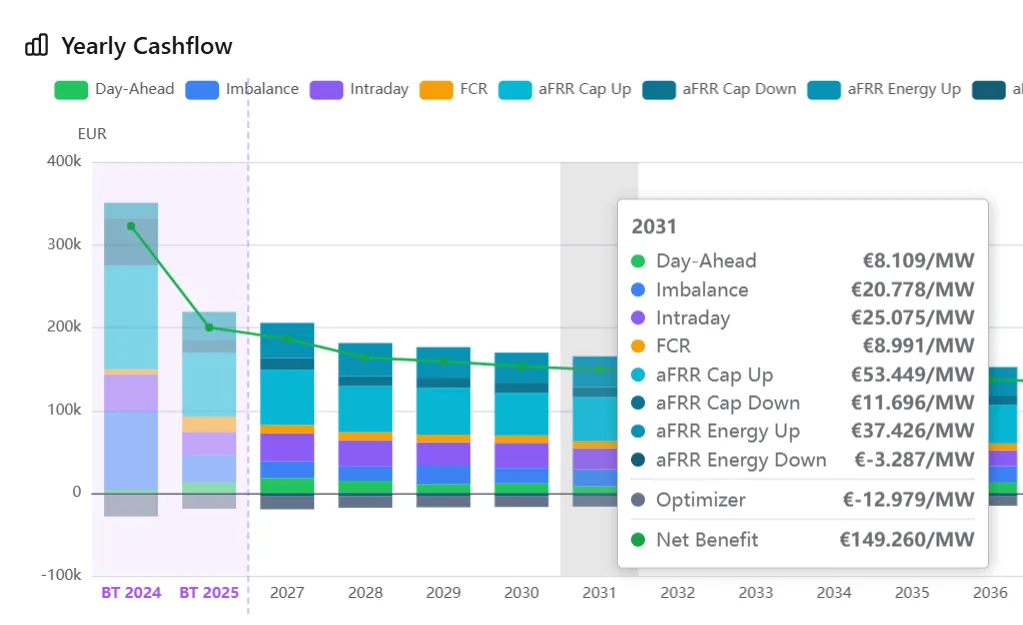
BESSview yearly BESS cashflow: stacked bars per year for day-ahead, imbalance and intraday revenue against negative transport and optimizer costs, with a net benefit line falling from 2026 to 2035 and the 2024 and 2025 backtest years on the same axis
Grid congestion model

BirdFlow

A high-resolution grid congestion model built on PyPSA-NL. BirdFlow estimates the expected hourly grid restrictions from 2027 onwards, so BESS, datacenter and industrial projects know what their connection will actually deliver.

  • Models all Dutch 380/220/150/110 kV lines, plus fossil and renewable plants
  • Load regionalized to individual substations
  • Accurate TDTR and VVTR offtake and feed-in congestion programs
  • Expected hourly restrictions per location, 2038 as standard and out to 2045 on request
  • For BESS, datacenters and industry planning to expand
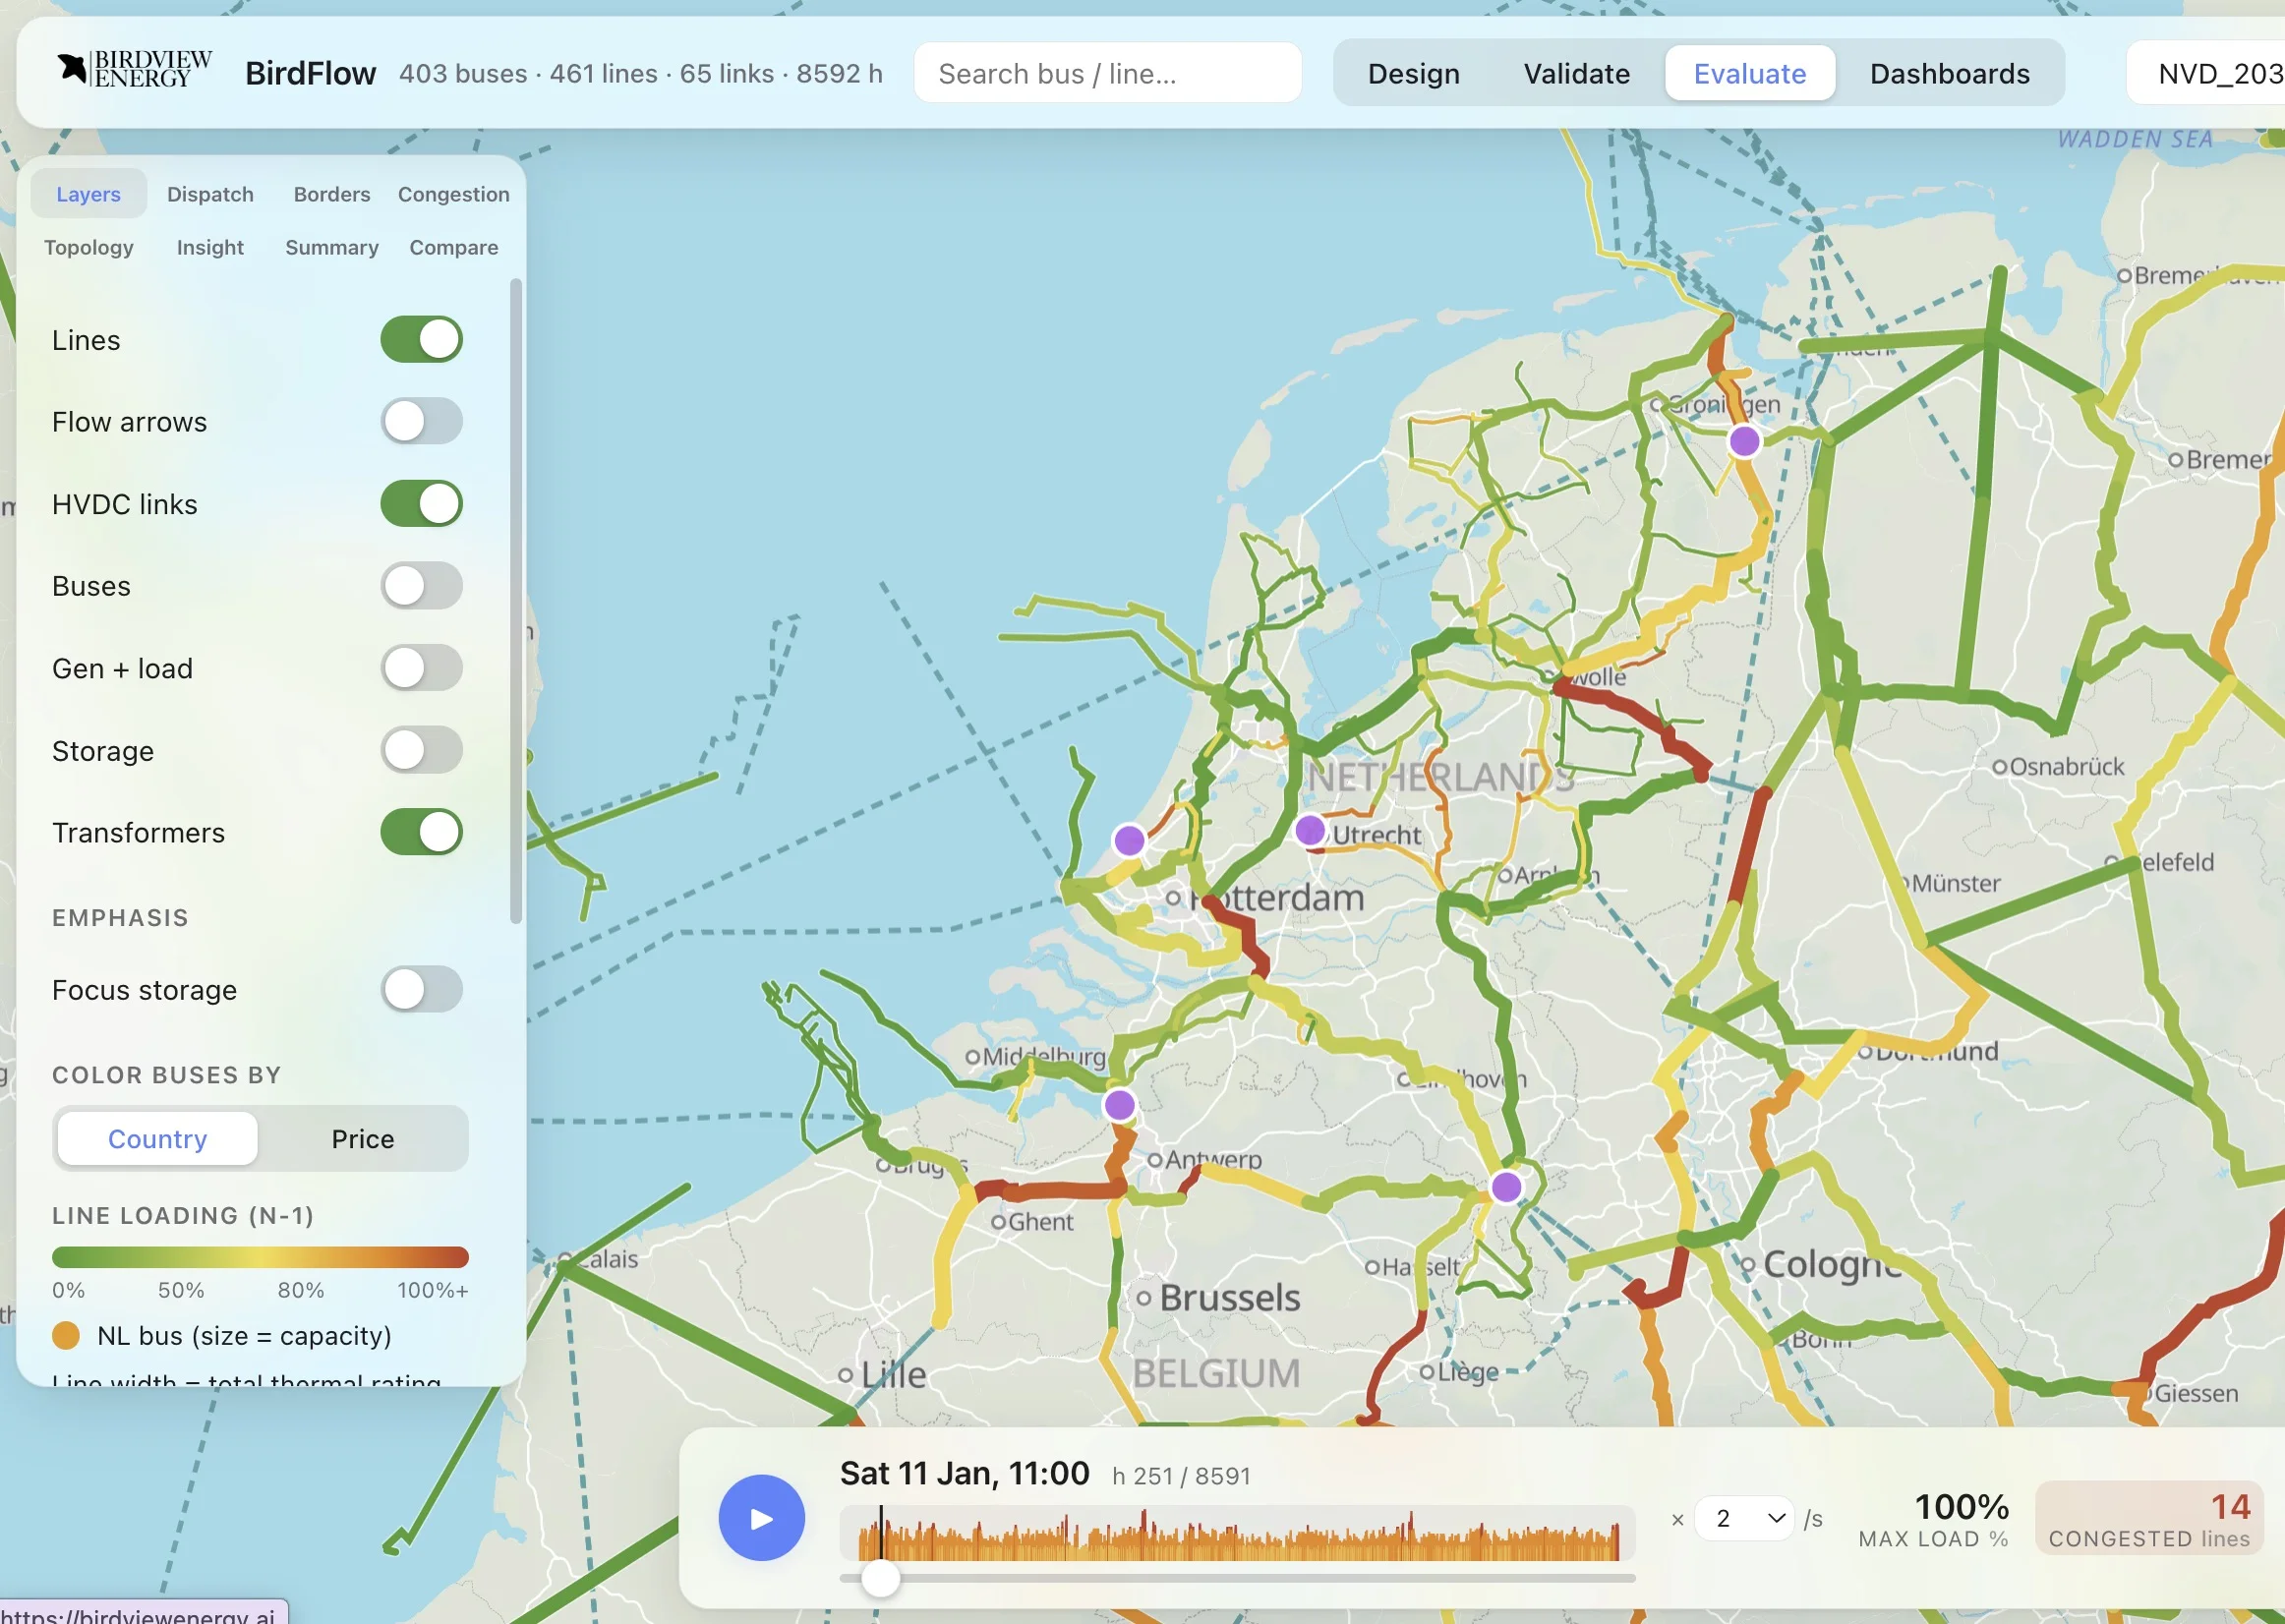
BirdFlow PowerFlow web interface: interactive map of the Dutch transmission grid with line loading and congestion

The PowerFlow web interface shows the full Dutch grid, every hour of the year

Capture-ratio backtest · available now

Benchmarking

Independent benchmarking of the party trading your battery. We backtest your site against the theoretical maximum revenue it could have earned, then report what share of that your optimizer actually captured. On a 10 MW / 40 MWh asset in 2025 that capture ratio was 61 percent.

  • Capture ratio against the theoretical maximum, per market and cross-optimized
  • Your own site: grid limits, co-located PV or industrial load, non-firm contracts
  • Scored on revenue, mistakes, feasible bids, forecast skill and reward against risk
  • Reported separately for weak and strong market days, never as one average

In development: live signal capture, so competing optimizers can dry-test on your asset in parallel without ever touching it.

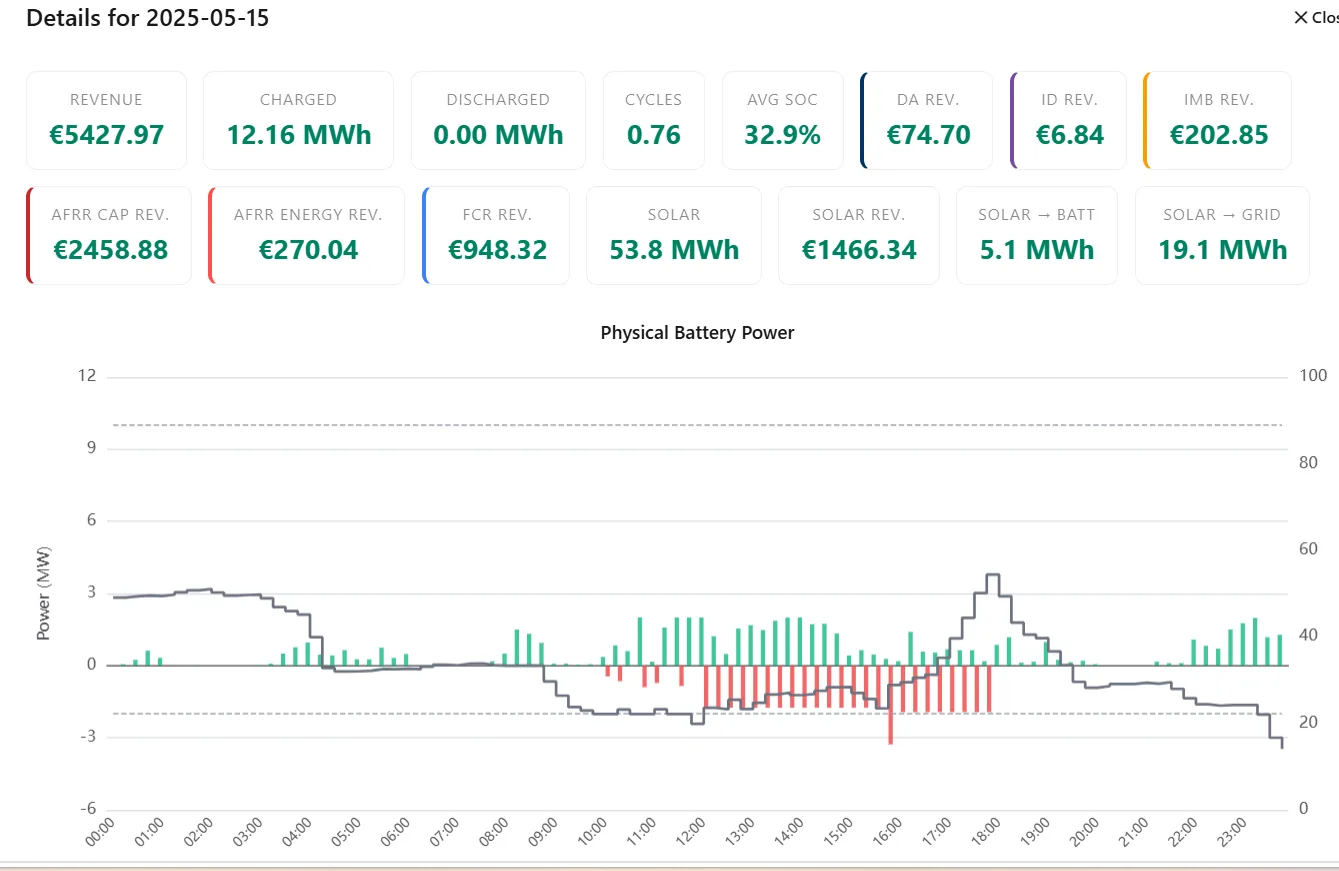
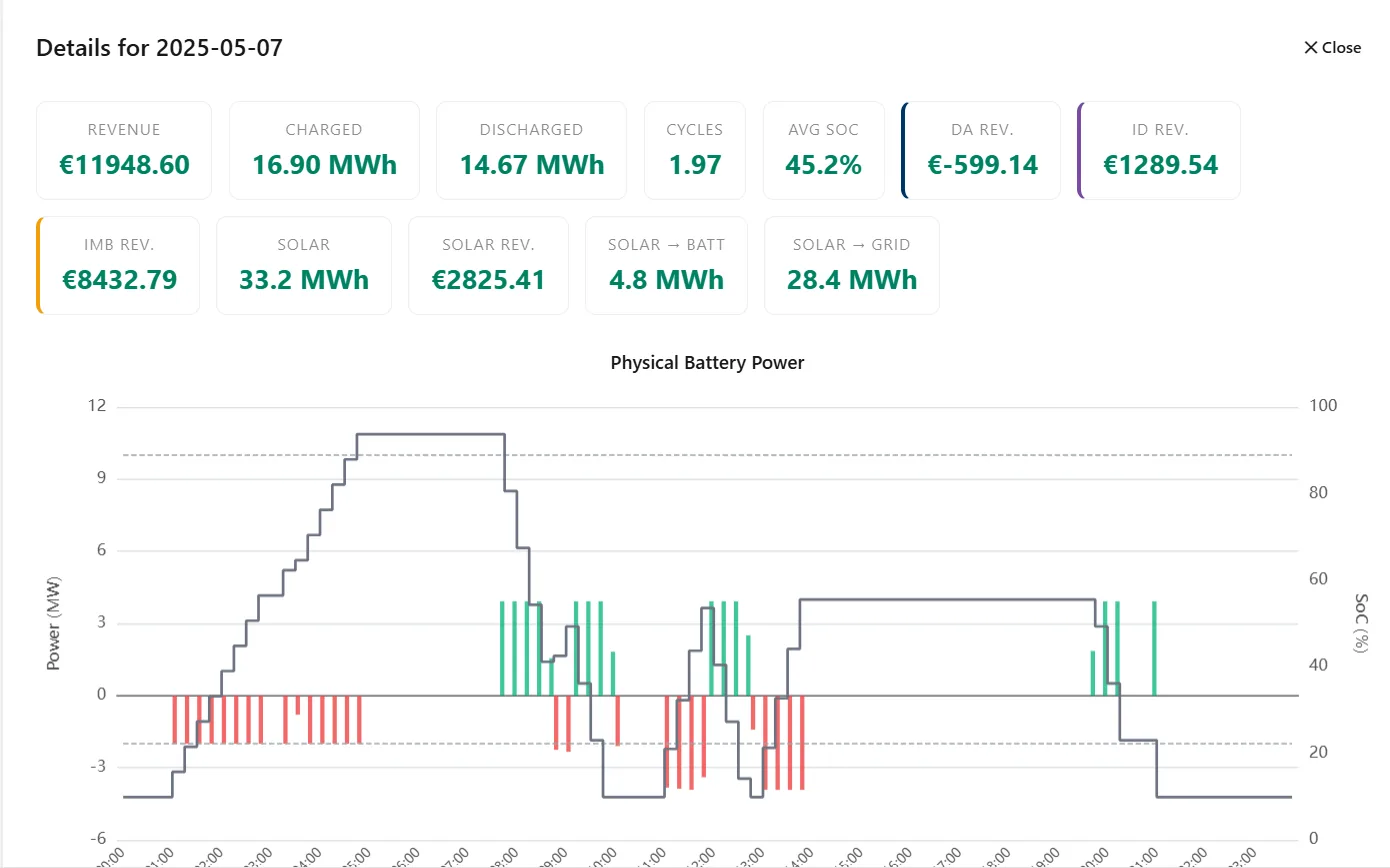
BESSview benchmark day view for a co-located solar and battery site: revenue by market, energy charged and discharged, cycles, average state of charge and the battery power profile

Define your project

Specify your site: grid connection, consumption profile, co-located assets, and local market. We calibrate a model to your exact configuration within one day.

Run scenarios in minutes

Adjust sizing, duration, dispatch strategy, and revenue stacking across DA, ID, FCR, aFRR, and imbalance markets. Compare outcomes instantly.

Export the report

Export revenue projections, sensitivities and risk assessment as a PDF report for lenders.

Partners, members and clients

Every number in the platform traces back to the settled series it was built from: EPEX day-ahead and intraday prices, and TenneT imbalance, aFRR and FCR settlement data. Each result can be checked against those inputs.

Standalone, solar+storage, wind+storage and behind-the-meter

The model runs on your connection capacity, your local congestion profile and the tariffs that apply at your site.

Standalone BESS: utility-scale battery storage installation
Solar+storage: solar farm co-located with battery storage
Wind+storage: mtu EnergyPack BESS wind farm project
Industrial behind-the-meter: industrial energy complex with co-located battery storage in the sun

Change one assumption at a time

Change the sizing, the price curve or the dispatch strategy and the run finishes in minutes, so you can find out what the case actually hangs on.

Calibrated to your project

Your grid connection, your local congestion profile, your co-located generation and the regulatory constraints on your site all go in as parameters, not as defaults.

Live in one day
Multiple scenarios
Export-ready outputs

Where the models come from

Built by traders and asset operators

The models are built by people who have traded energy, financed projects and operated assets. The assumptions come from how these markets behave in practice.

Multi-market coverage

DA, intraday, FCR, aFRR, imbalance, across NL, DE, RO and expanding. Every revenue stream is modelled on real market data.

Benchmarking

Measure an operating battery against the theoretical maximum revenue its own site could have earned, and see what share the optimizer actually captured.

Masterclass

7

October 2026

09:30 to 17:00 · full day

Only 20 seats

Masterclass series

Grid Congestion Masterclass

A full day, across eight sessions, on what a congested grid does to a project: TDTR/VVTR restrictions, non-firm connections (ATO), and the revenue impact on PV, BESS and hybrid projects. For developers, investors and lenders who need to price the grid correctly.

Eight sessions, one full day Congestion, TDTR/VVTR & non-firm ATO For developers, investors & lenders

Run your project through the platform

Request a 30-minute demo and we come back with a sample output for your own configuration.